How to trace customer value down to the parts that deliver it
Part 4 of 5 in our series on the next generation of R&D.
A bill of materials records what a product is made of. It has no column for why. Over a few generations parts accumulate: a shroud added for one retailer's shelf, a wall thickness that was the supplier's default, a sleeve from a relaunch nobody on the current team worked on. Each was reasonable once, and nothing in the BOM says whether the reason still holds.
Here is that column, filled in for one product. The method is a stripped-down house of quality, the matrix Hauser and Clausing described in 1988, carried one step further to cost. It usually produces two findings. One is cost with no customer reason behind it. The other, which matters more, is a feature buyers care about a great deal resting on almost nothing.
Building the trace
You need two lists for the same product: what buyers value, and what the product costs, line by line.
- List what buyers value, in their words, with counts. "One-handed dose" is a valued feature. "Spring-loaded piston" is how you deliver it. Note which features are simply expected. In Kano terms those earn no praise when they work, so their evidence is in the complaints.
- Break the bill of materials down until one line is one decision. If removing half of a line would be a sensible proposal, the line needs splitting. Put a cost on each.
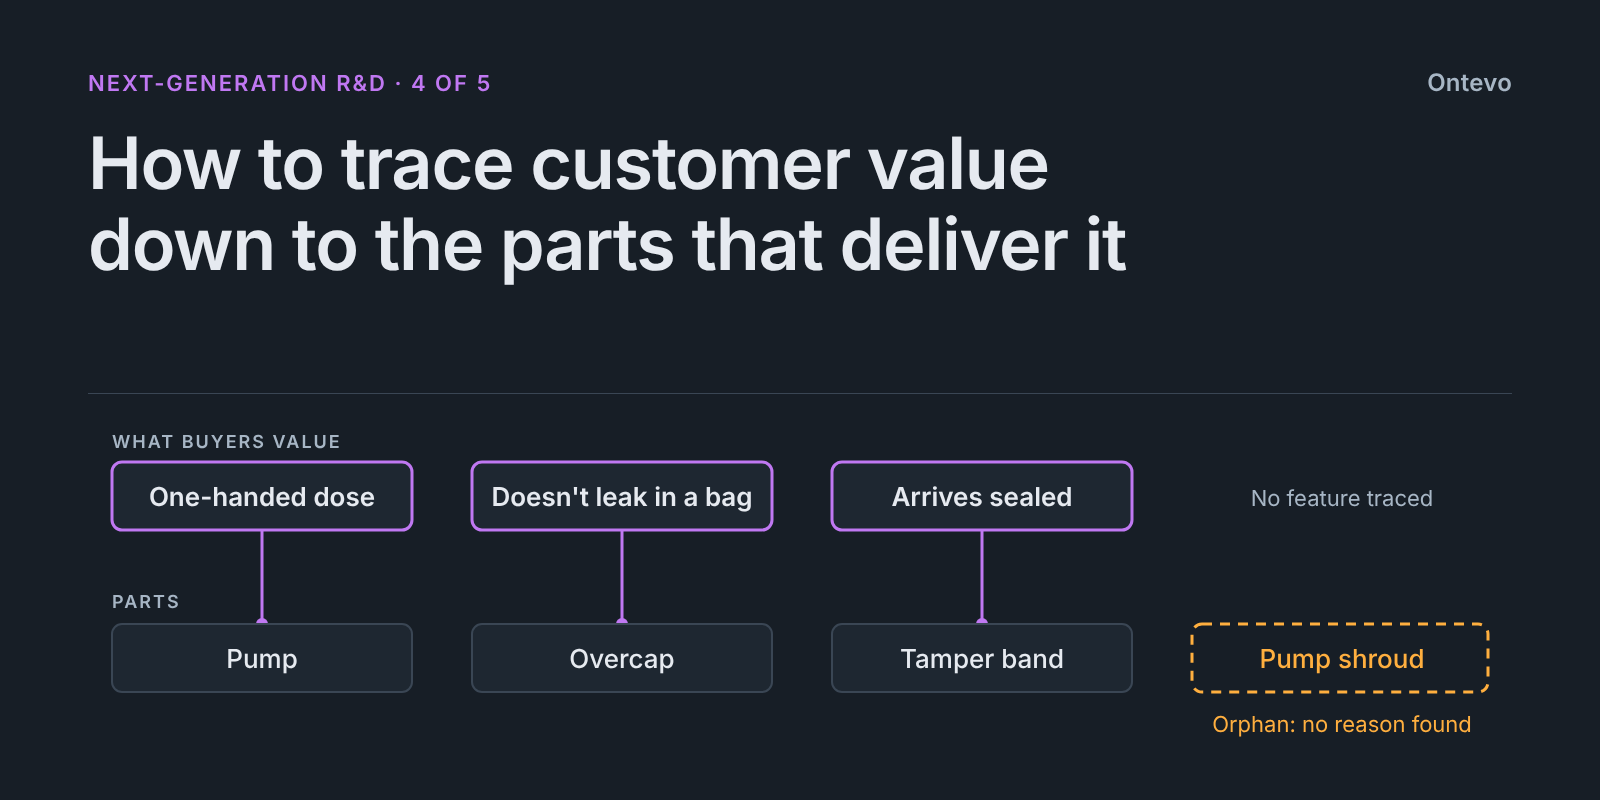
- For every line, ask which valued feature would get worse if this part were cheaper, smaller or gone. Record the link and its direction, because a part can help one feature and hurt another. A wider pump opening doses faster and is easier to press by accident. Write down how you know. A buyer naming the part is strong evidence. An engineering mechanism is a reasoned hypothesis, and the two should be marked differently.
- Label each line. It delivers something buyers value, or the product can't legally or physically exist without it (filling, testing, freight, mandatory labeling), or no reason was found. Requirements engineers have a word for an item that traces to nothing: an orphan.
A part that serves two features doesn't need its cost split between them to the cent. Classic function-cost analysis does make that split, by judgment, and the false precision tends to become the argument. List both features and move on.
The bottle, traced
Here is the trace for the product this series follows, a 90 ml travel pump bottle of body lotion with a unit cost of $3.00. The parts, counts and costs are illustrative, invented to show the method.
| Cost line | Unit cost | Valued feature it serves | Evidence in 1,000 buyer texts | Label |
|---|---|---|---|---|
| Lotion, 90 ml | $0.95 | Absorbs fast, no greasy hands | 310 | Delivers |
| Bottle | $0.32 | Fits carry-on limits; survives a bag | 96 and 21 | Delivers |
| Pump works: actuator, housing, piston, spring, dip tube | $0.53 | One-handed dose | 88 | Delivers |
| Tamper band | $0.06 | Arrives sealed | 37 | Delivers |
| Overcap | $0.05 | Doesn't leak in a bag | 182 | Delivers, barely |
| Label | $0.09 | Required product information | 12 | Needed to exist |
| Fill, assemble, test | $0.34 | None named | 0 | Needed to exist |
| Case pack and freight | $0.35 | None named | 0 | Needed to exist |
| Metallized pump shroud | $0.05 | None found | 0 | Orphan |
| Printed outer sleeve | $0.26 | Looks like a gift | 4 | Orphan candidate |
The lines that deliver a valued feature come to $0.95 + $0.32 + $0.53 + $0.06 + $0.05 = $1.91, or 63.7% of unit cost. The lines the product needs in order to exist come to $0.09 + $0.34 + $0.35 = $0.78, or 26.0%. The orphan and the orphan candidate are $0.05 + $0.26 = $0.31, or 10.3%. The three add back to $3.00. Check that every time, because a trace that drops a line loses finance in the first five minutes.
Read from the cost side, a tenth of this product's cost sits behind features almost nobody mentions. The shroud has no evidence at all. The sleeve has four texts, none from a buyer explaining a choice.
Read from the customer side, the finding is sharper. The most common subject in the evidence, 182 texts about leaks in a bag, is carried after first use by one $0.05 overcap. That is 1.7% of unit cost. Of those 182 texts, 41 say the cap fell off or got lost.
The product spends about six times as much on those two lines as on the part carrying its biggest complaint: $0.31 ÷ $0.05 = 6.2. No single document in the company shows that. The research deck has the 182 and the BOM has the $0.05.
Before you cut an orphan
An orphan is a question, and it needs an owner. A part with no customer evidence and no recorded reason may still have a reason that a little digging turns up. Before removing one, check whether it meets a requirement buyers assume and never mention, such as tamper evidence. Check whether it matters to a customer other than the end buyer, such as a retailer with a shelf standard, whether it protects another part in shipping or use, and whether one segment values it even though the total count is low.
The sleeve might pass the retailer check in one channel. If it does, it stays for that channel and remains an orphan everywhere else. If nothing applies, the cost is available, and the customer side of the trace has already shown where to spend part of it. Part 2 works that trade through in value engineering that starts with what customers notice.
The trace depends on what buyers write, and a feature with no mentions may be valued in silence, so treat a zero in the evidence column as a reason to check. The trace also treats cost as fixed per part, when a change to one part can alter assembly time or scrap on another. Confirm with engineering tests and a sample in real hands before anyone changes a drawing.
The two lists, from Ontevo
Both lists come out of Ontevo's Full Diagnostic today. The Product Definition view shows the segments in a category and the jobs each hires the product for, and its Kano Features tab classes each feature as expected, performance or delighter, with a note on how strong the evidence is. The Cost Efficiency analysis produces a leveled, costed bill of materials and can break a single line, such as a pump assembly, into its parts. The costs are modeled estimates with their assumptions listed.
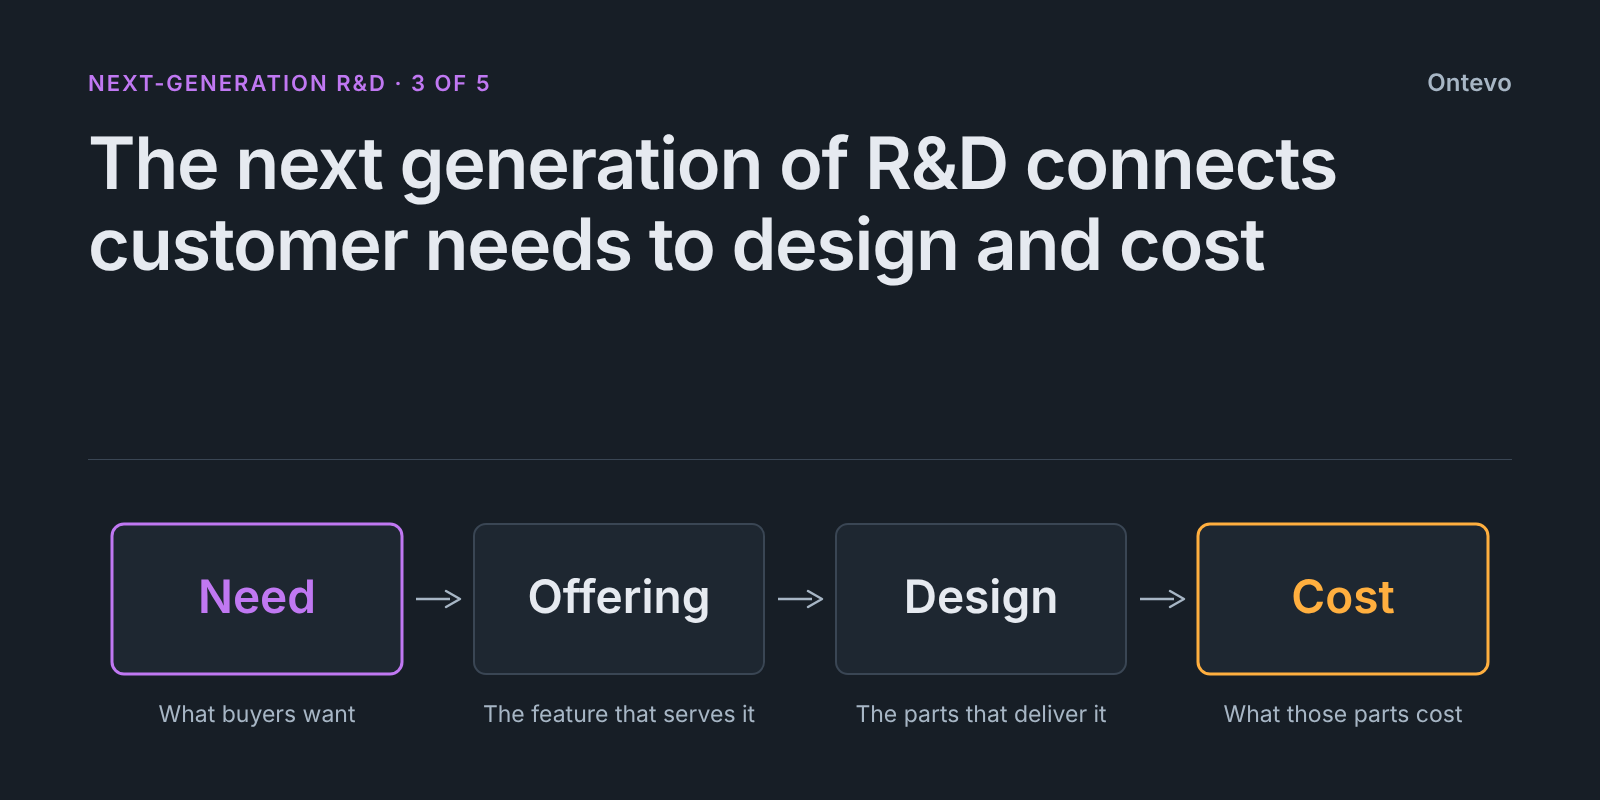
The links between the two lists are what we're building now, in a view called Connections that is still in development. It's designed so that AI proposes which parts serve which features and marks each proposal as its own suggestion, for your engineers to confirm or correct. Part 3 explains the design: connecting customer needs to design and cost. You can see the customer side of the trace in the sample report, and the full sequence on how Ontevo works.
Tell us one product. We'll show you its Full Diagnostic in a 30-minute demo. Book a Demo.
Ontevo Research. Where this post carries figures, they come from Ontevo's own scan corpus or are modeled from scan patterns across the category. No figure is measured from a named customer.