
Your air purifier loses large-room buyers. Here is why, and what to build next.
A sample Full Diagnostic on one HEPA air purifier, read against three competing products. Every number below names its source.
Tell us one product. We'll show you its Full Diagnostic in a 30-minute demo. If it's a fit, you get a one-week trial. No charge.
What this diagnostic found
Who it loses
It does the job for 28% of large-room buyers. Competitor A: 73%.
Why
The listing first states room size in bullet 4. Room size comes up 87 times per 1,000 reviews and questions, against 19 for Competitor A.
What it is worth
The top fix, a title and first-image edit, is modeled at $5,270 a month.
What to build next
A model for rooms up to 600 sq ft. 4 of 6 simulated large-room buyers chose it.
It wins one buyer group of three and loses the large-room buyers.
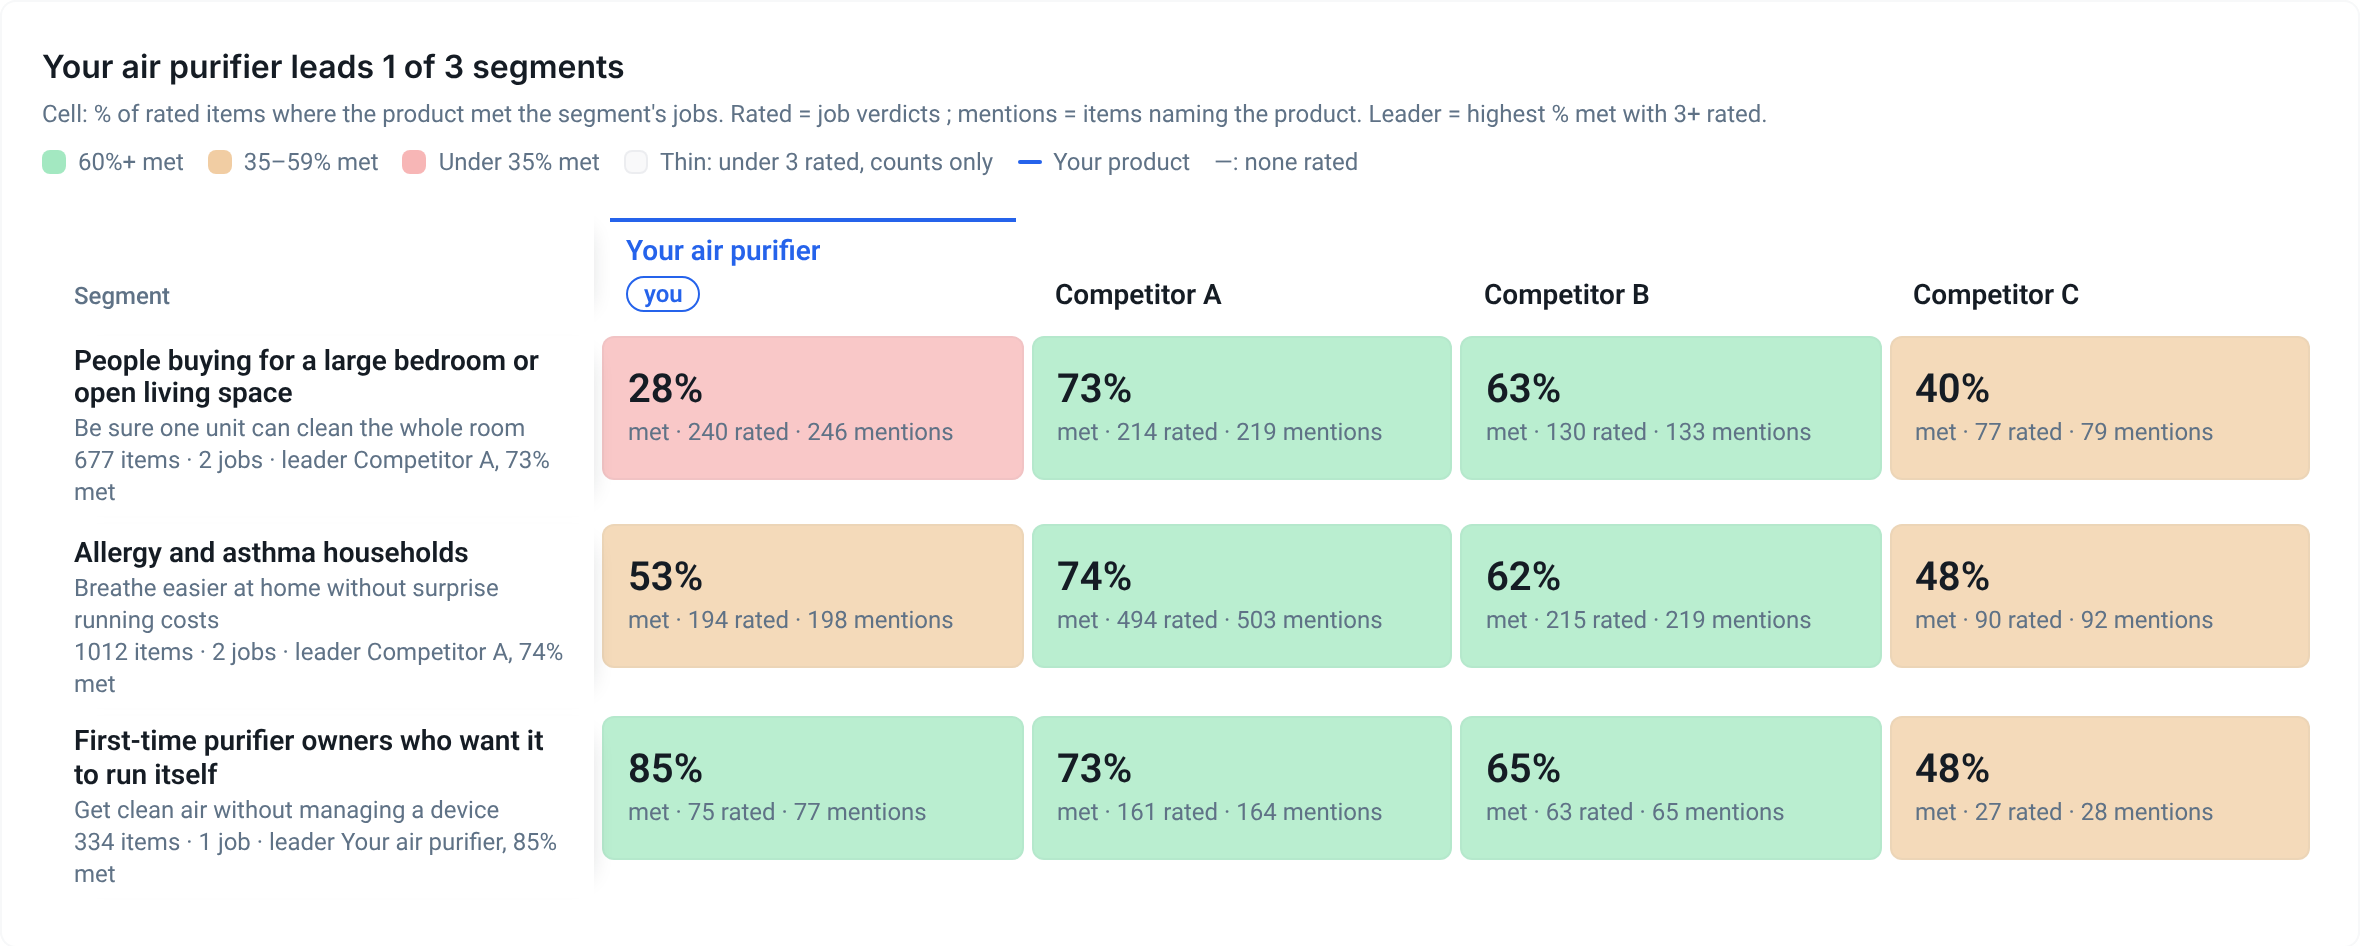
The Full Diagnostic starts with who buys in the category and what each group needs the product to do. Each cell is the share of that group's reviews and questions where the product did the job, shown as “% met”. “Rated” is how many could be judged.
Wins first-time owners, 85% met. Loses large-room buyers, 28% met against 73% for Competitor A.
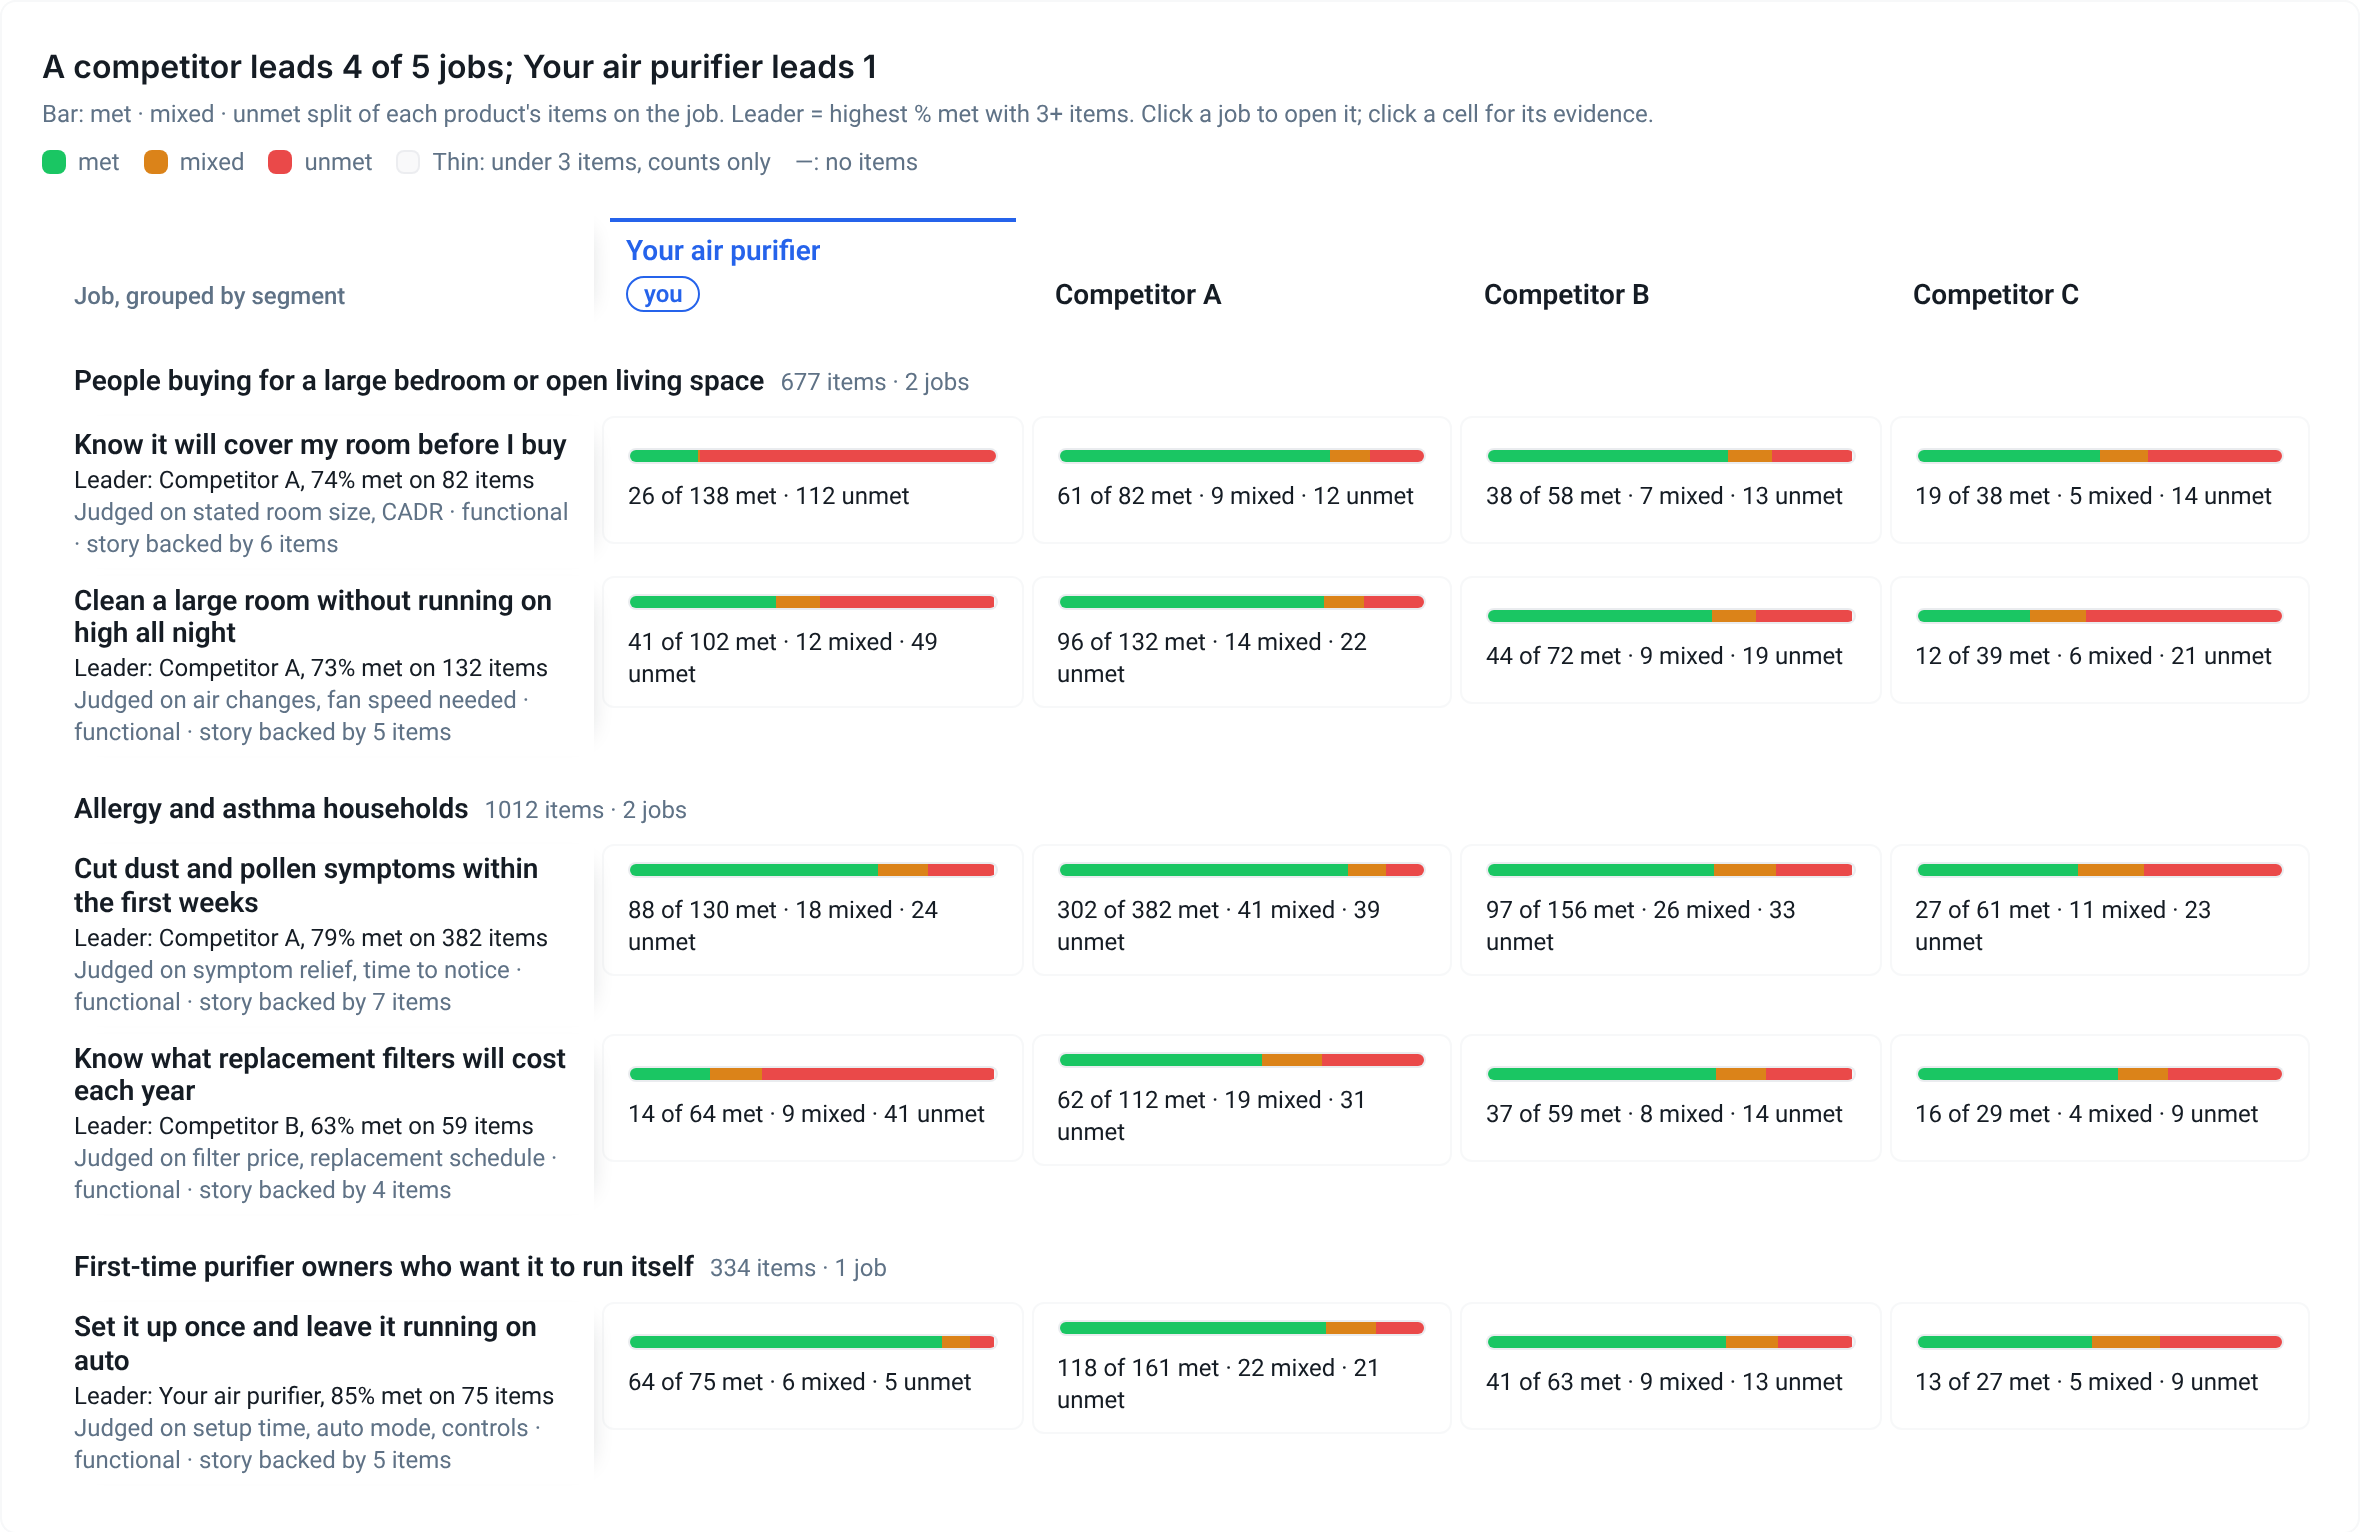
“Know it will cover my room before I buy” is unmet in 112 of your 138 rated items, and in 12 of 82 for Competitor A.
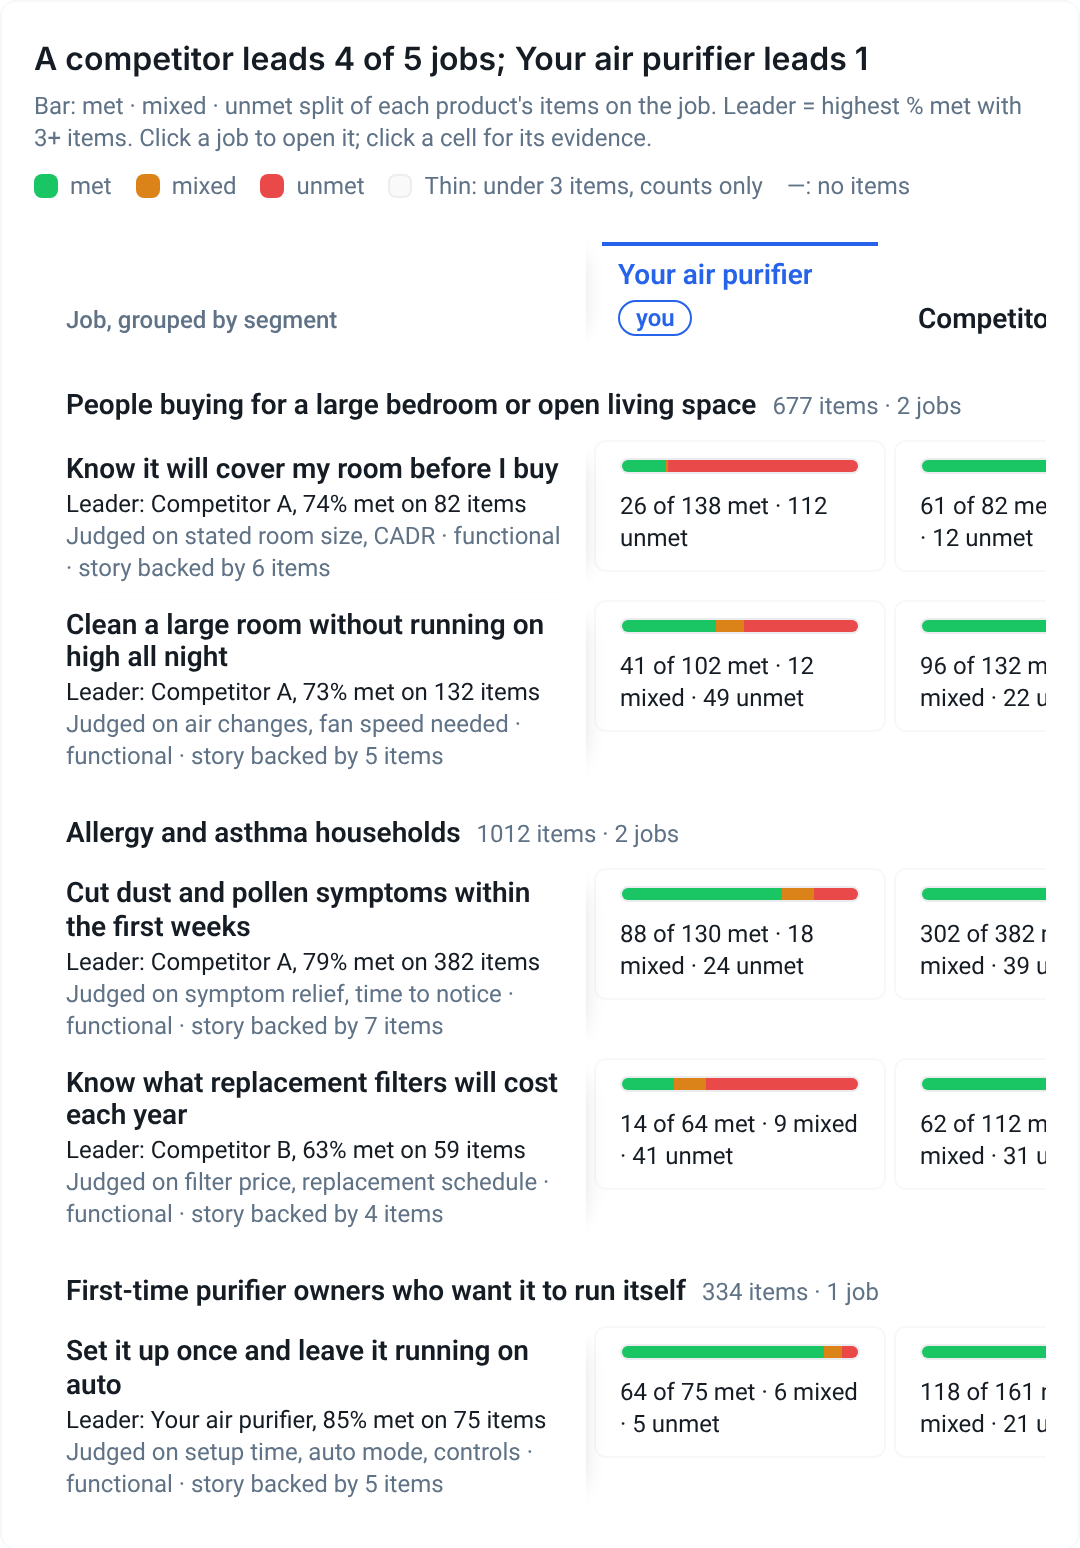
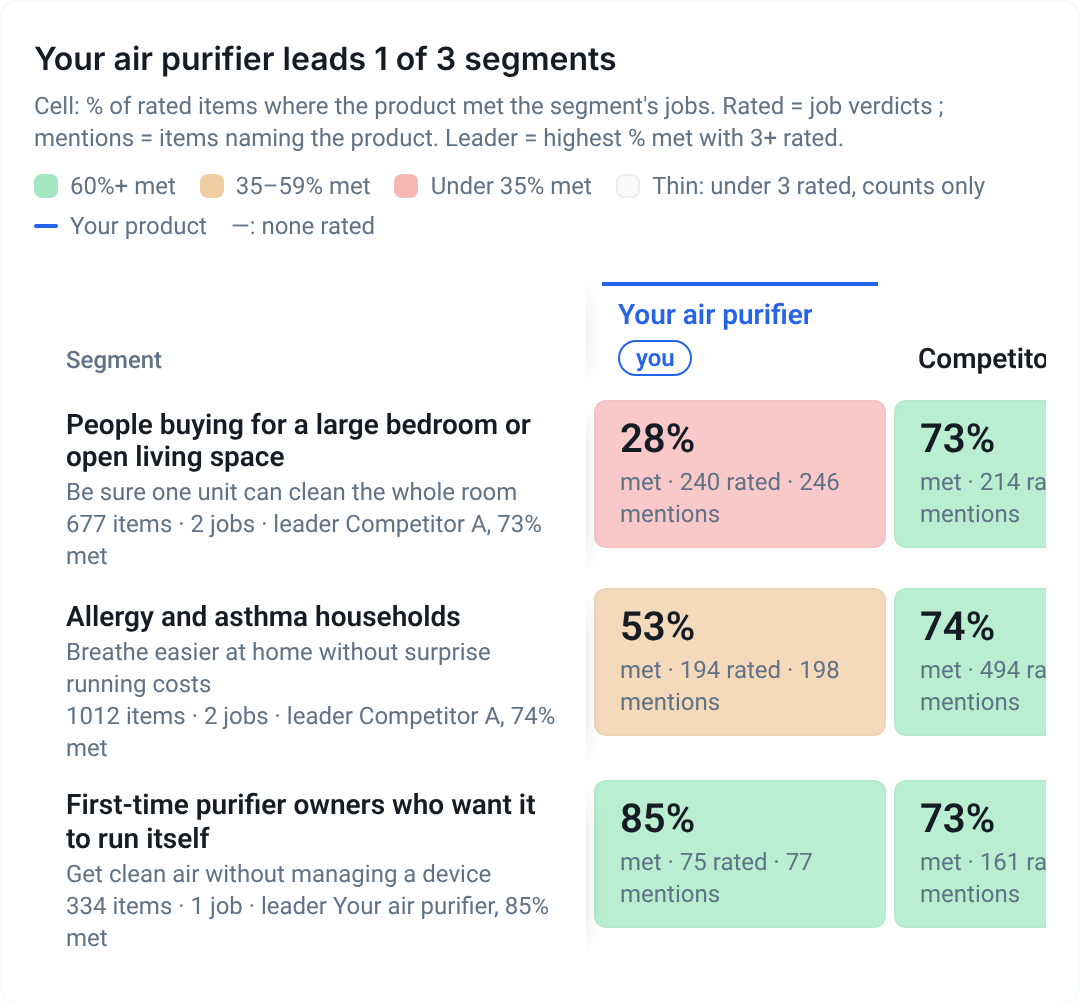
On a phone the matrix shows your air purifier's column first. In the product, the other three scroll into view.
Product Definition
One segment, two jobs, two different fixes
Your air purifier wins first-time owners who want it to run itself: 64 of 75 rated items say it did the job (85%), against 73% for Competitor A. It loses people buying for a large bedroom or open living space, 28% against 73%. That segment has two jobs. “Know it will cover my room before I buy” is a listing problem, and the top fix below prices it. “Clean a large room without running on high all night” is a product problem, and it is the case for what to build next.
Counted from reviews and listing questions that name each product. In the product, every cell opens the evidence behind it.
Buyers weigh room coverage most, and it is where yours is rated worst.
The 50-point analysis covers five pillars: Offering & Demand, Reputation, Search, Website and AI Visibility. These are the lead cards from each. The first two explain the large-room loss, and the other three are the rest of the picture.
1 of 5 · Offering & Demand
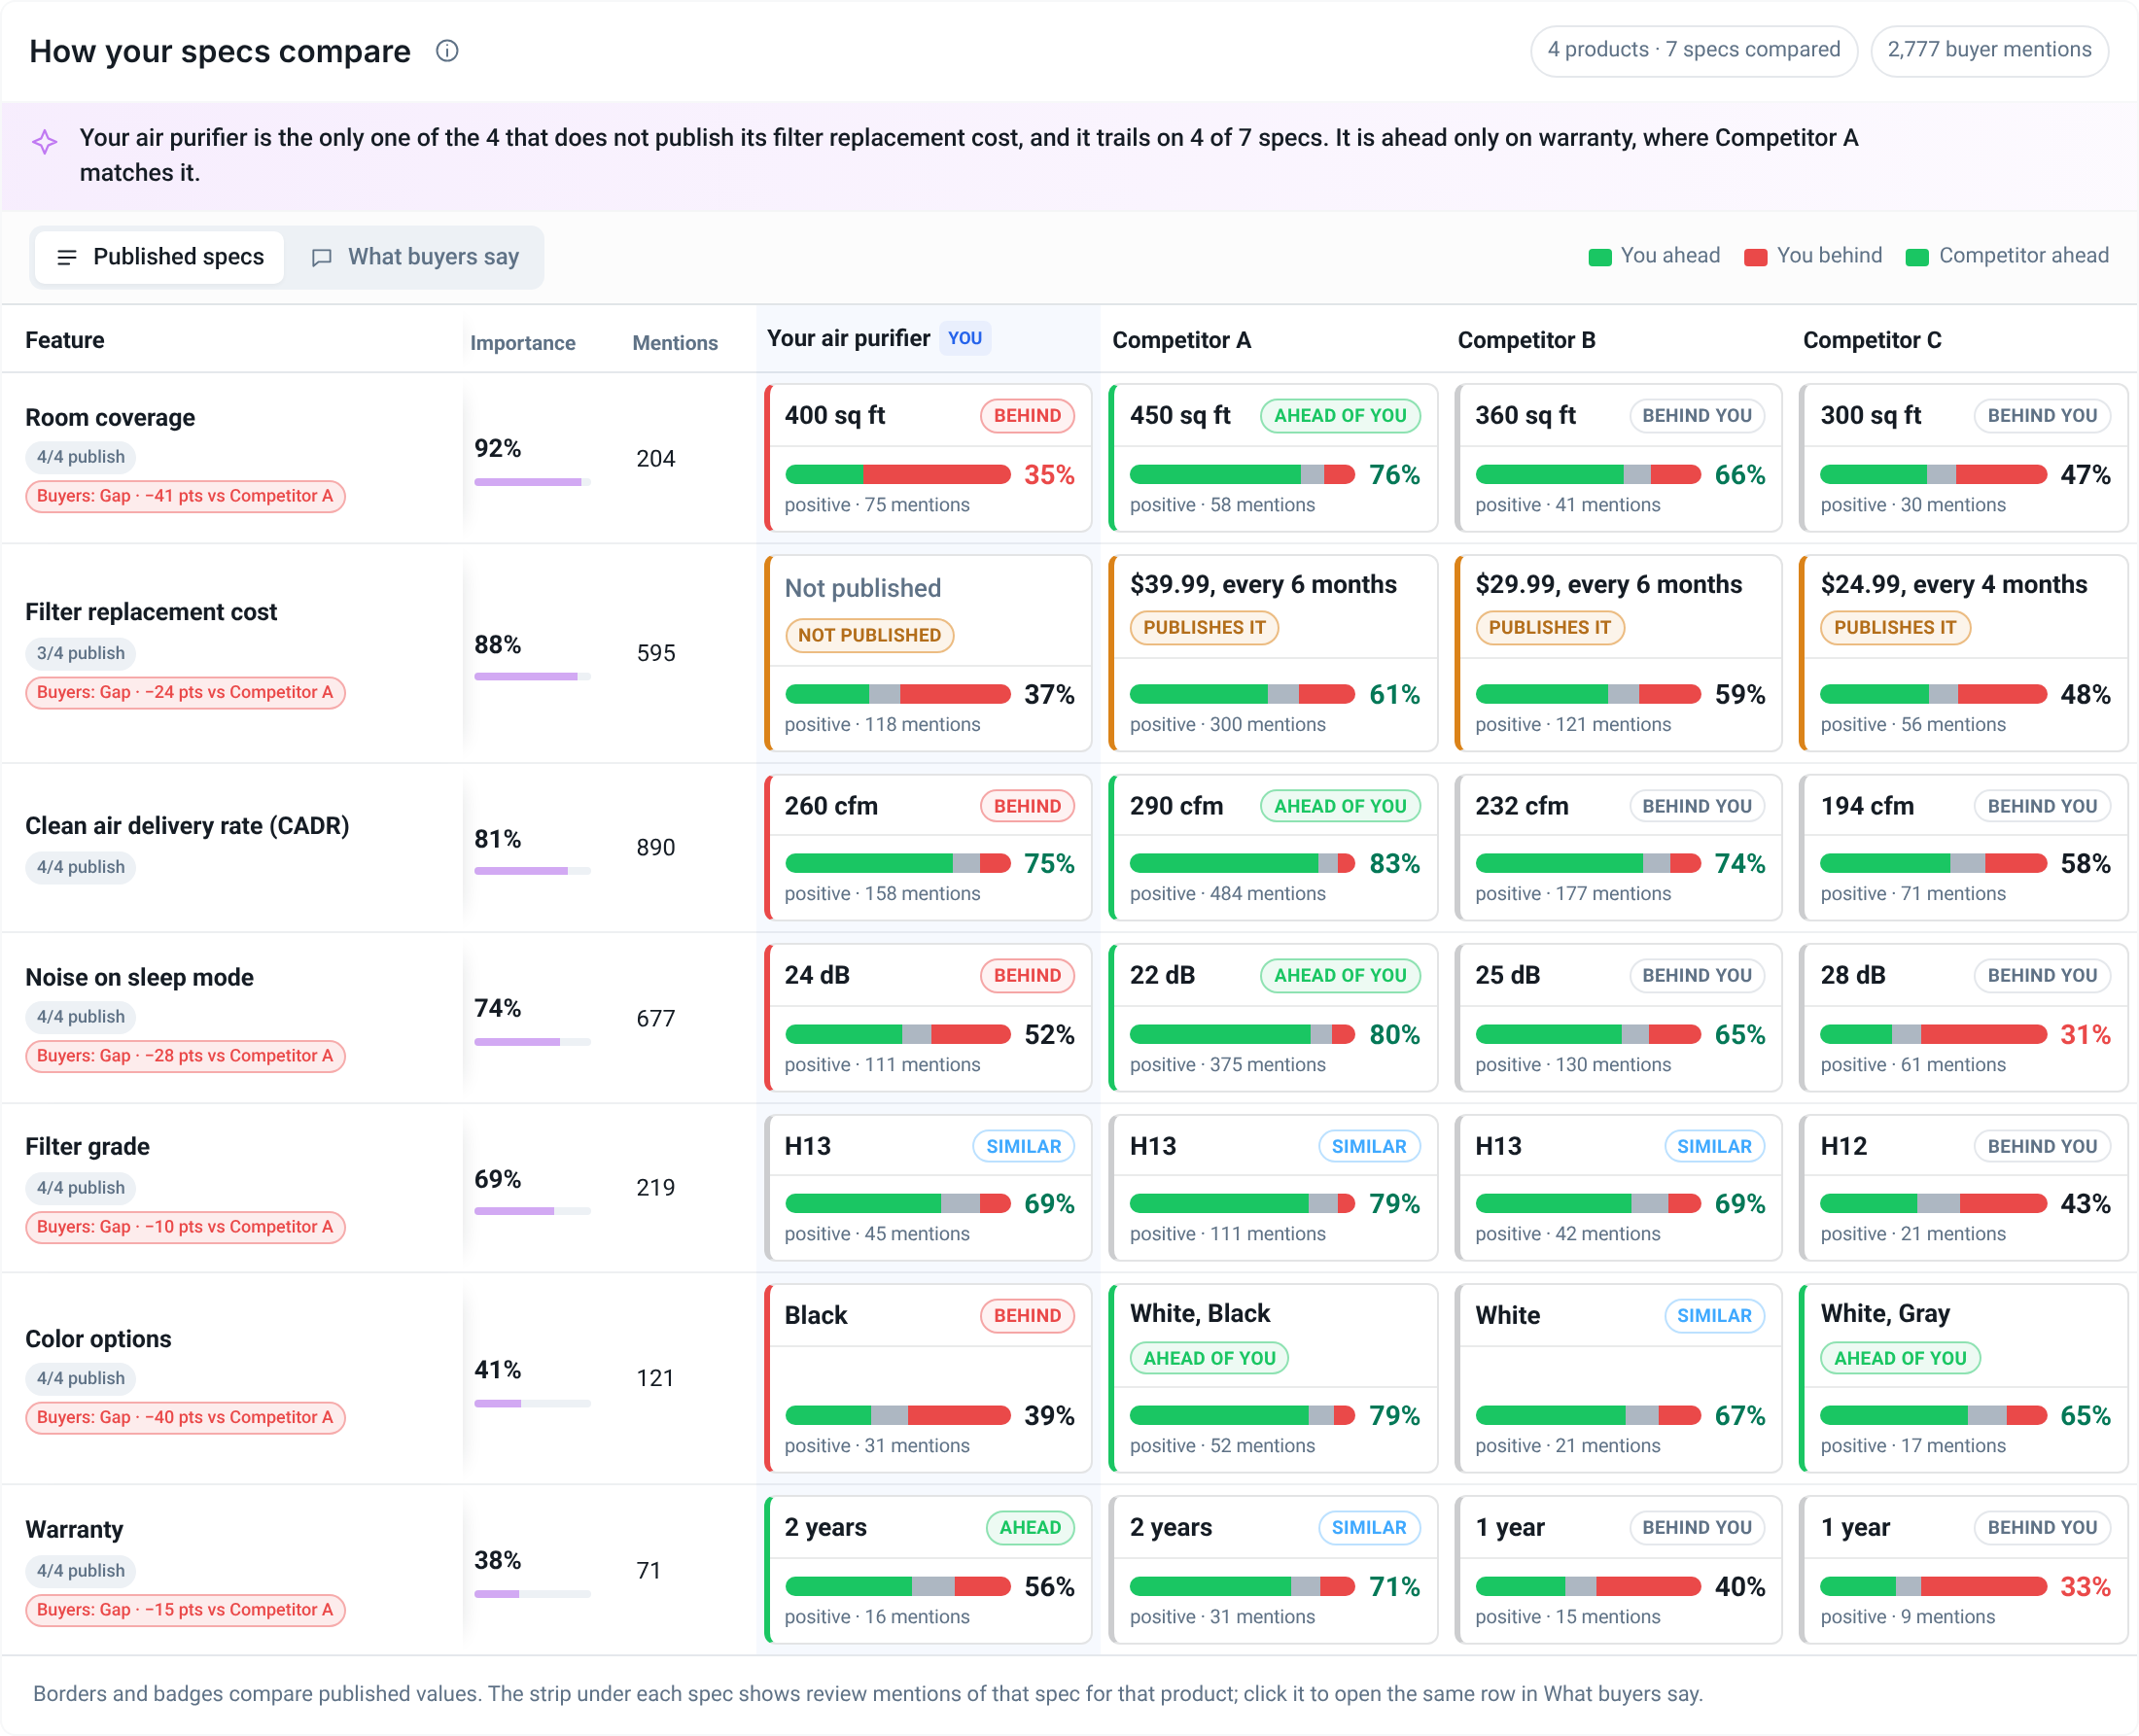
Your 400 sq ft is second of four, yet only 35% of buyer mentions are positive
Seven published specs in the order buyers weigh them. Under each, the share of buyer mentions that are positive. Competitor A: 76%.
Open the full card ↗
2 of 5 · Reputation
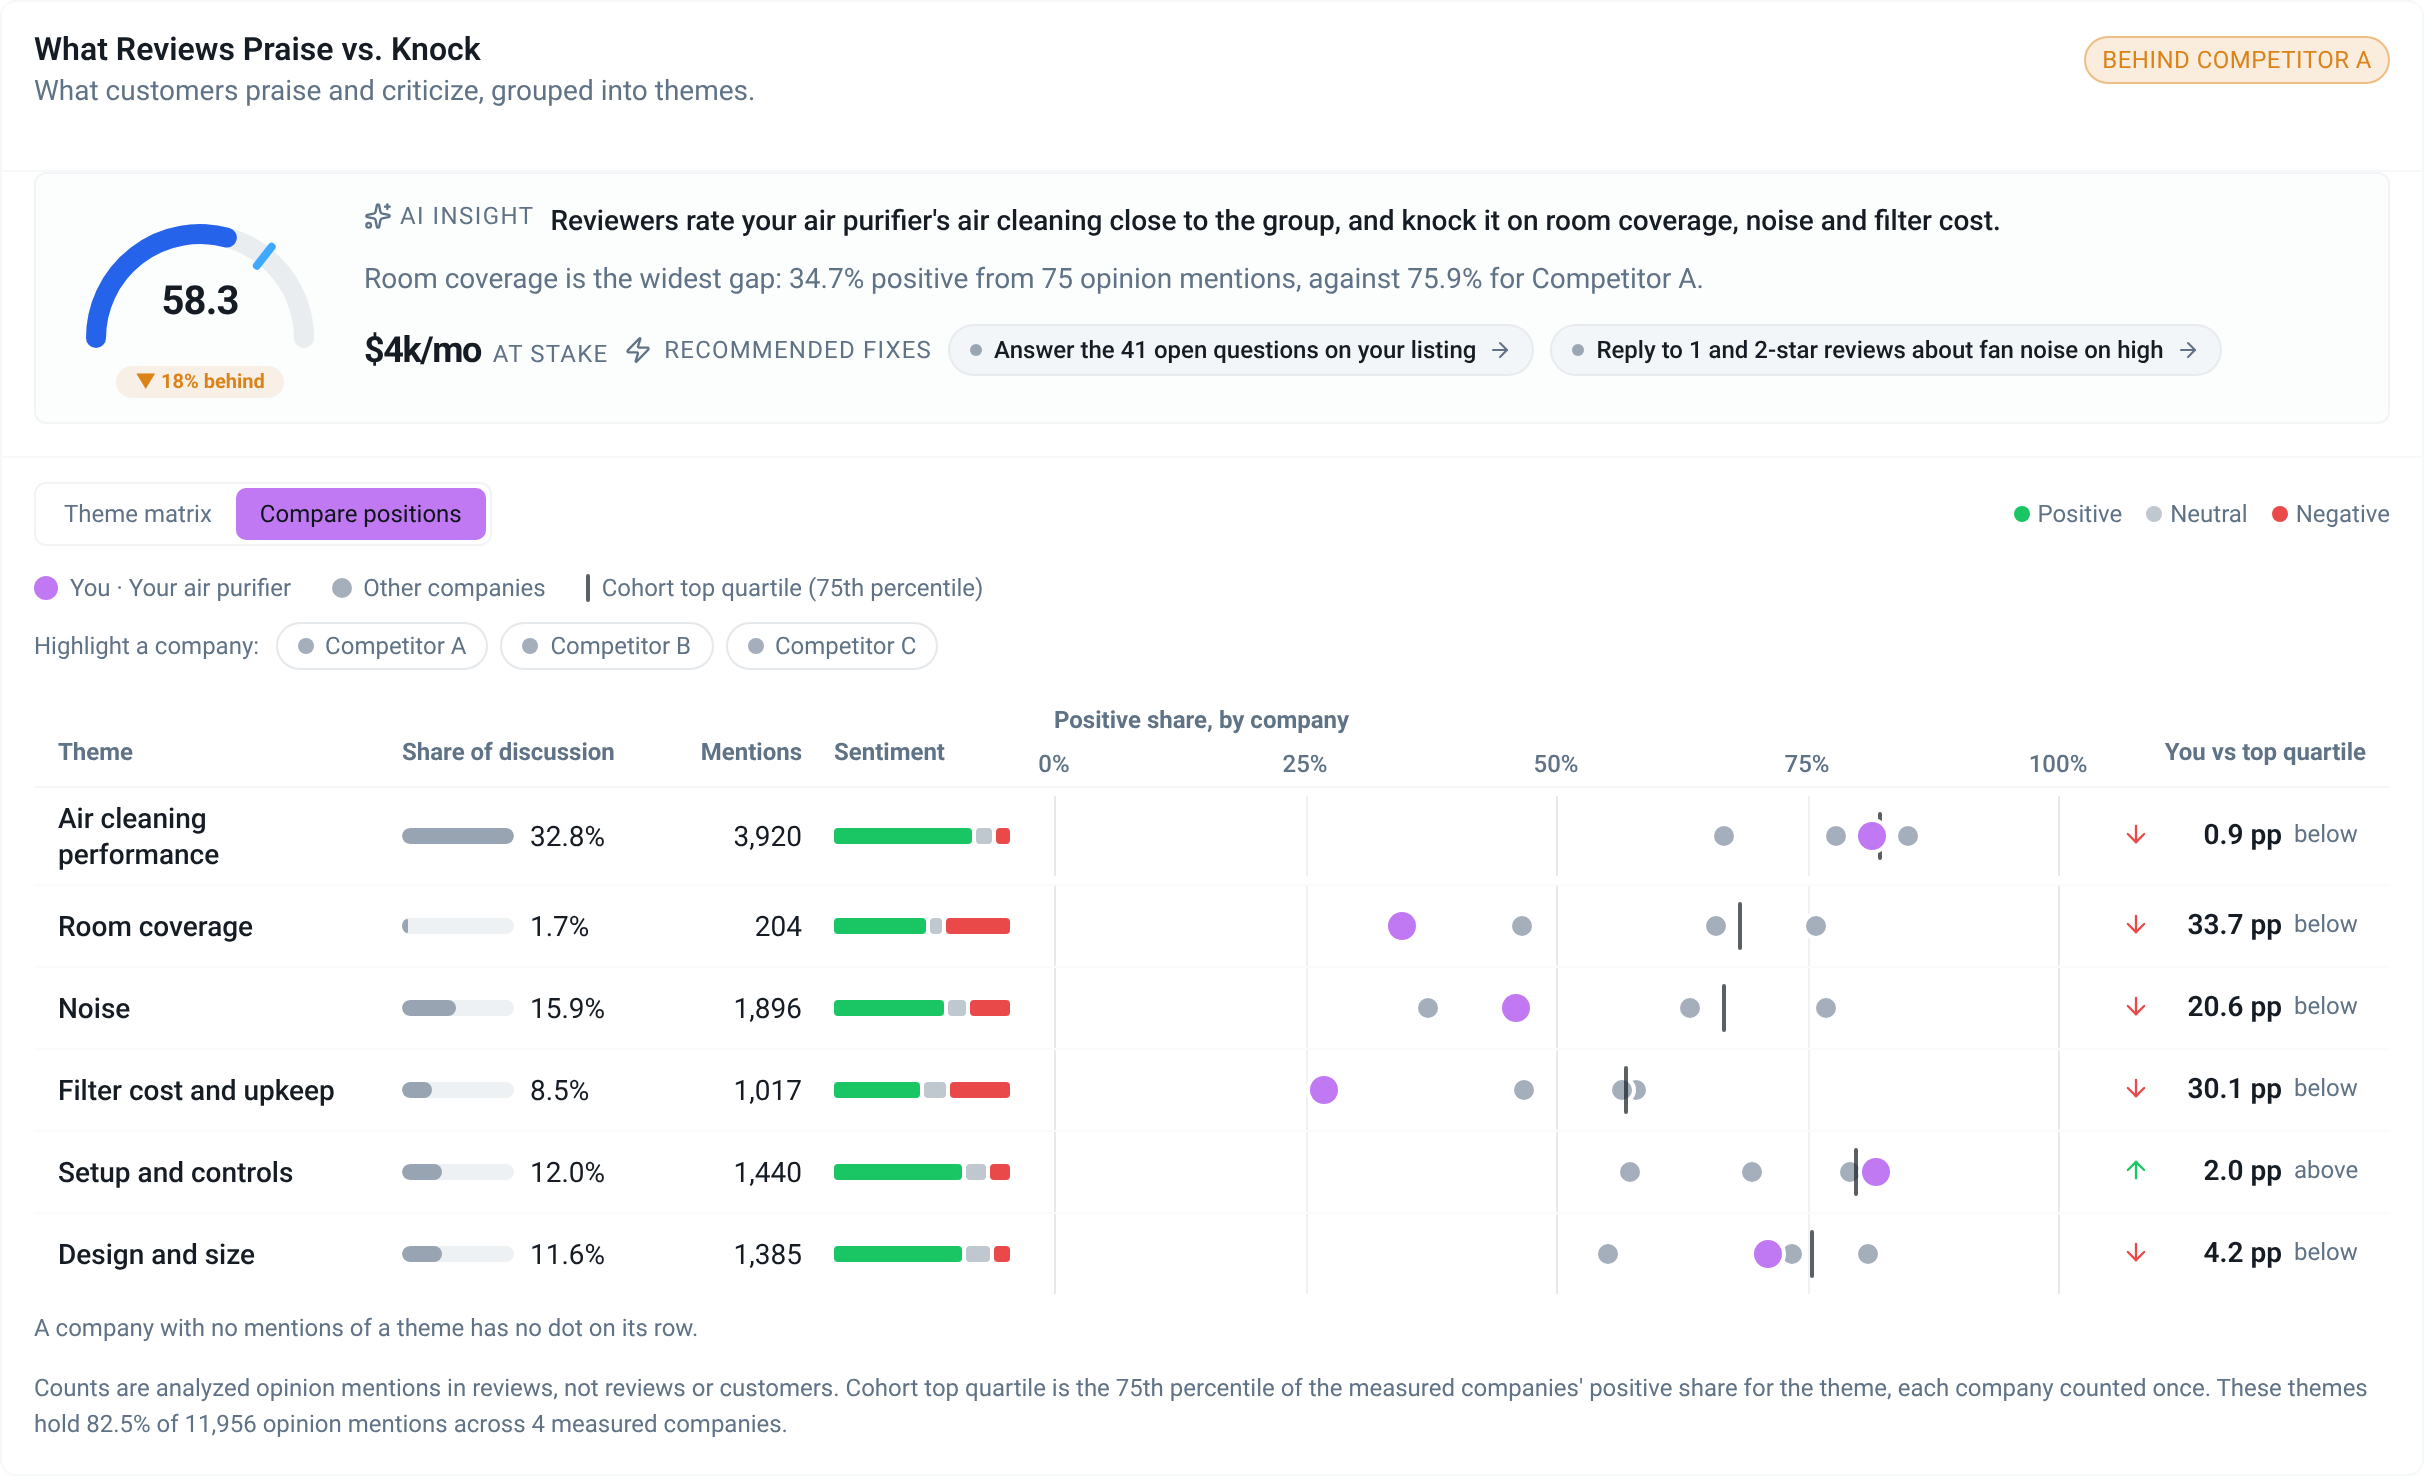
Reviews knock its room coverage, noise and filter cost
Six review themes, each product's share of positive mentions, against the top quarter of the group.
Open the full card ↗
3 of 5 · Search
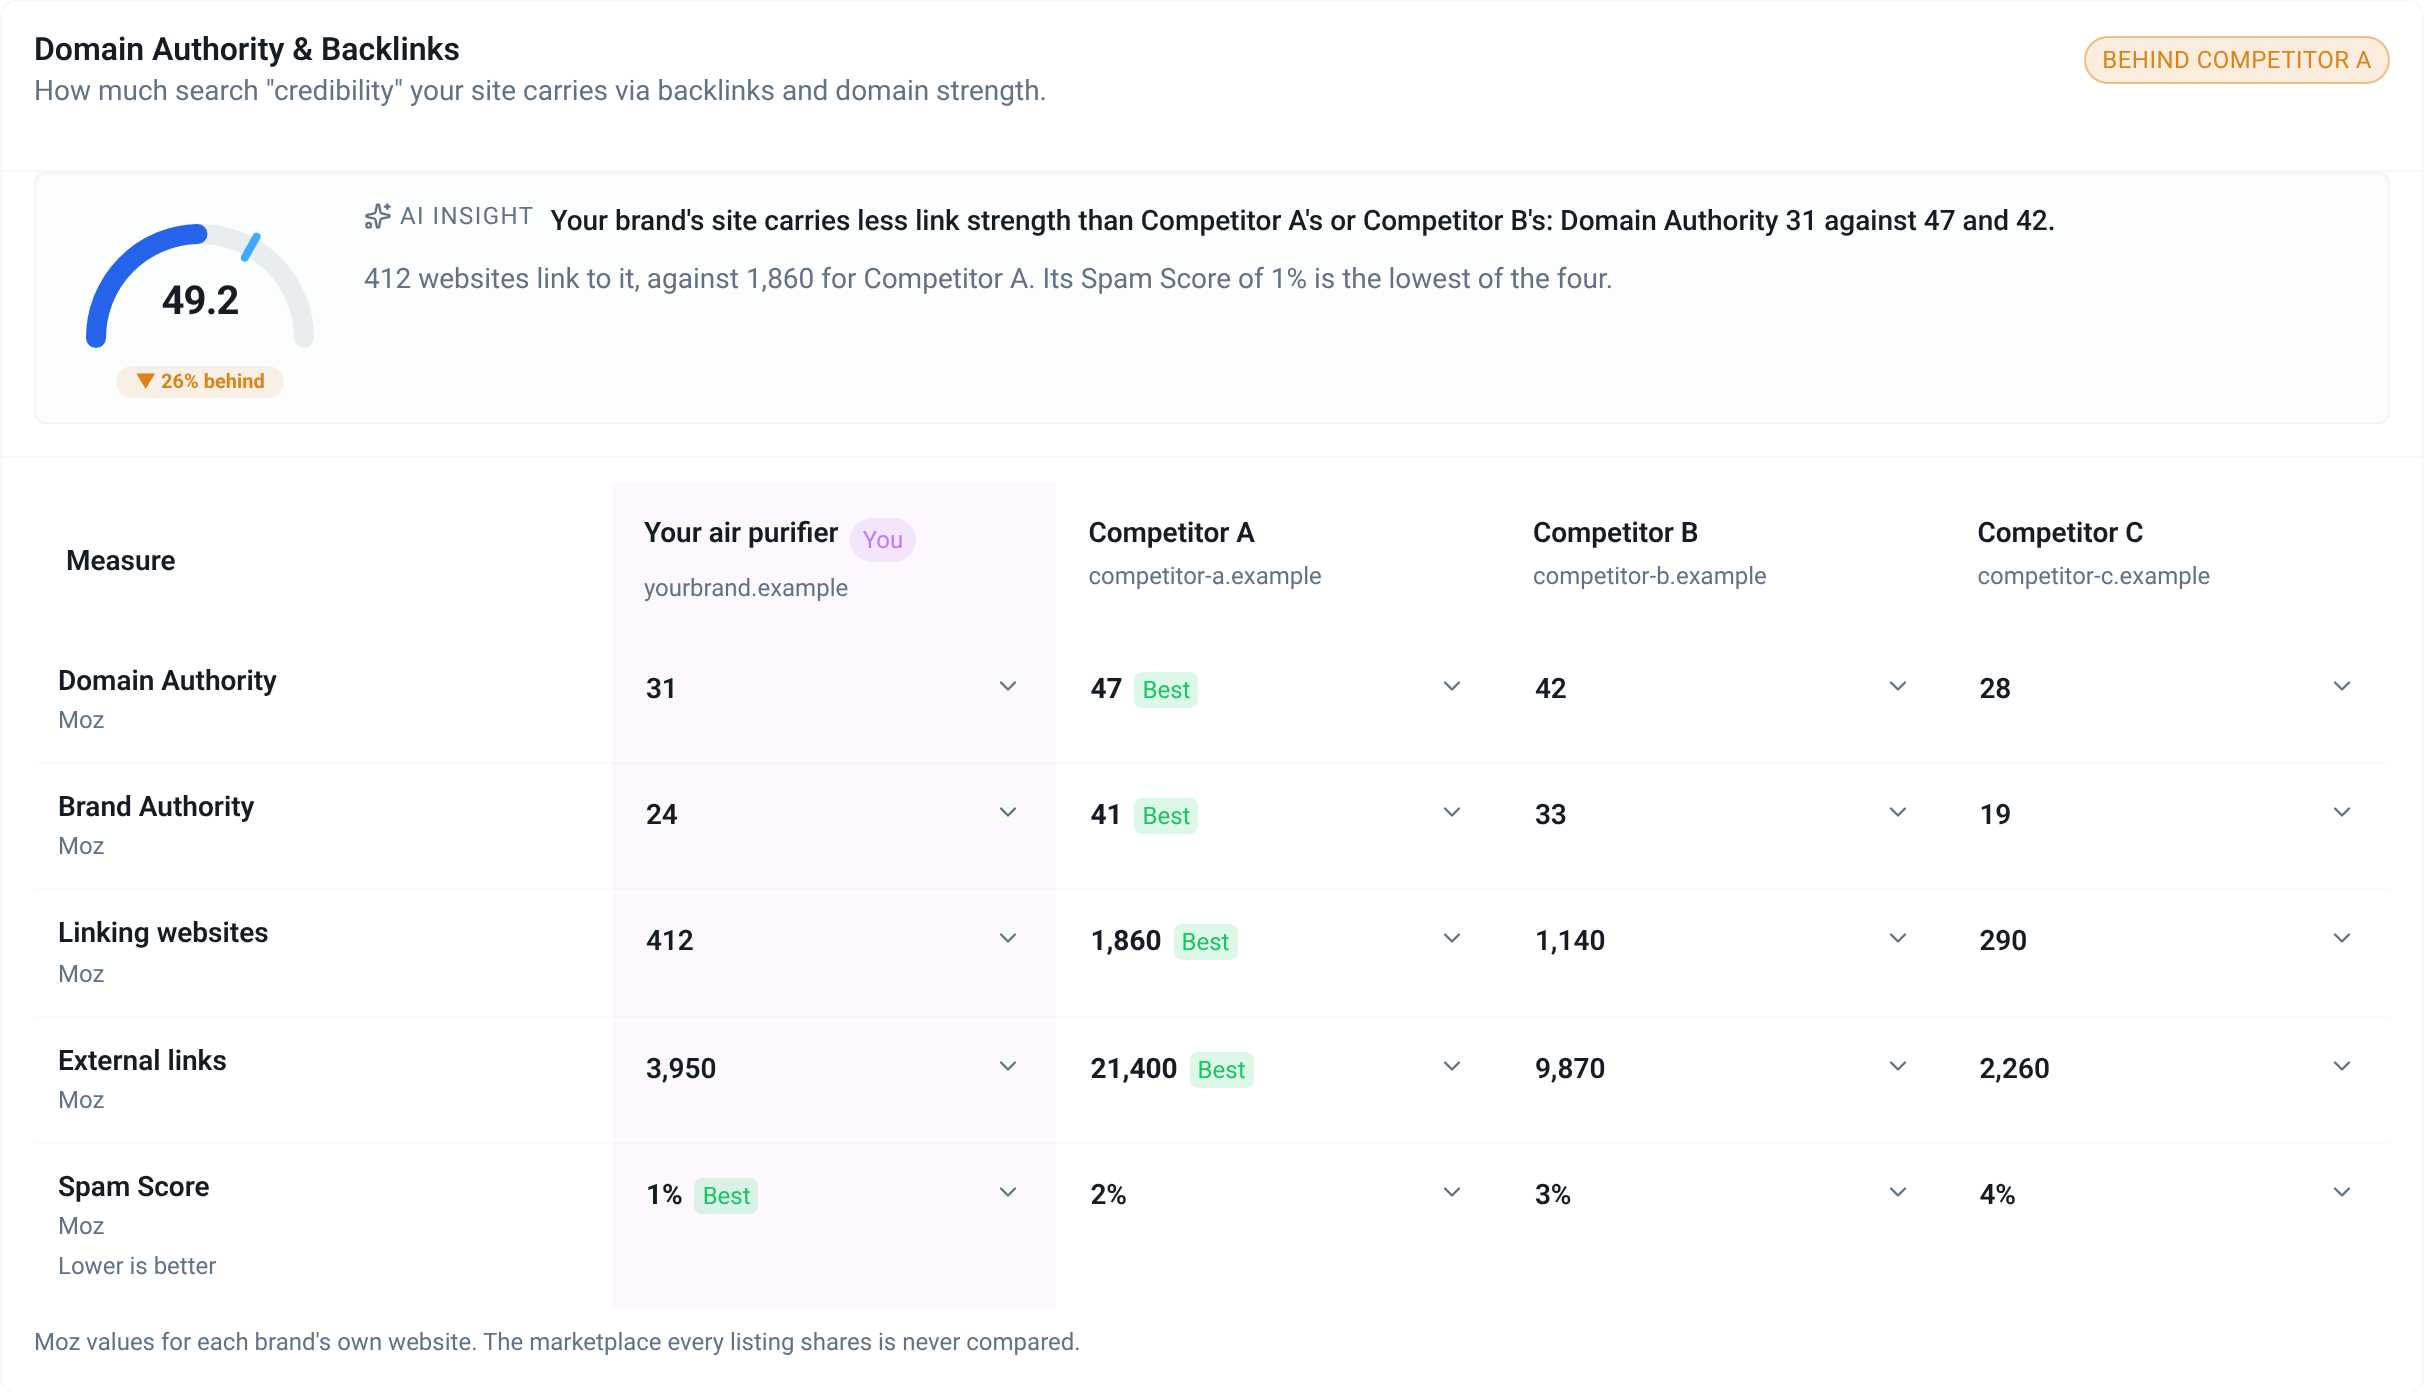
Fewer sites link to your brand's website
Moz link measures for each brand's own site: Domain Authority 31 against 47 for Competitor A.
Open the full card ↗
4 of 5 · Website
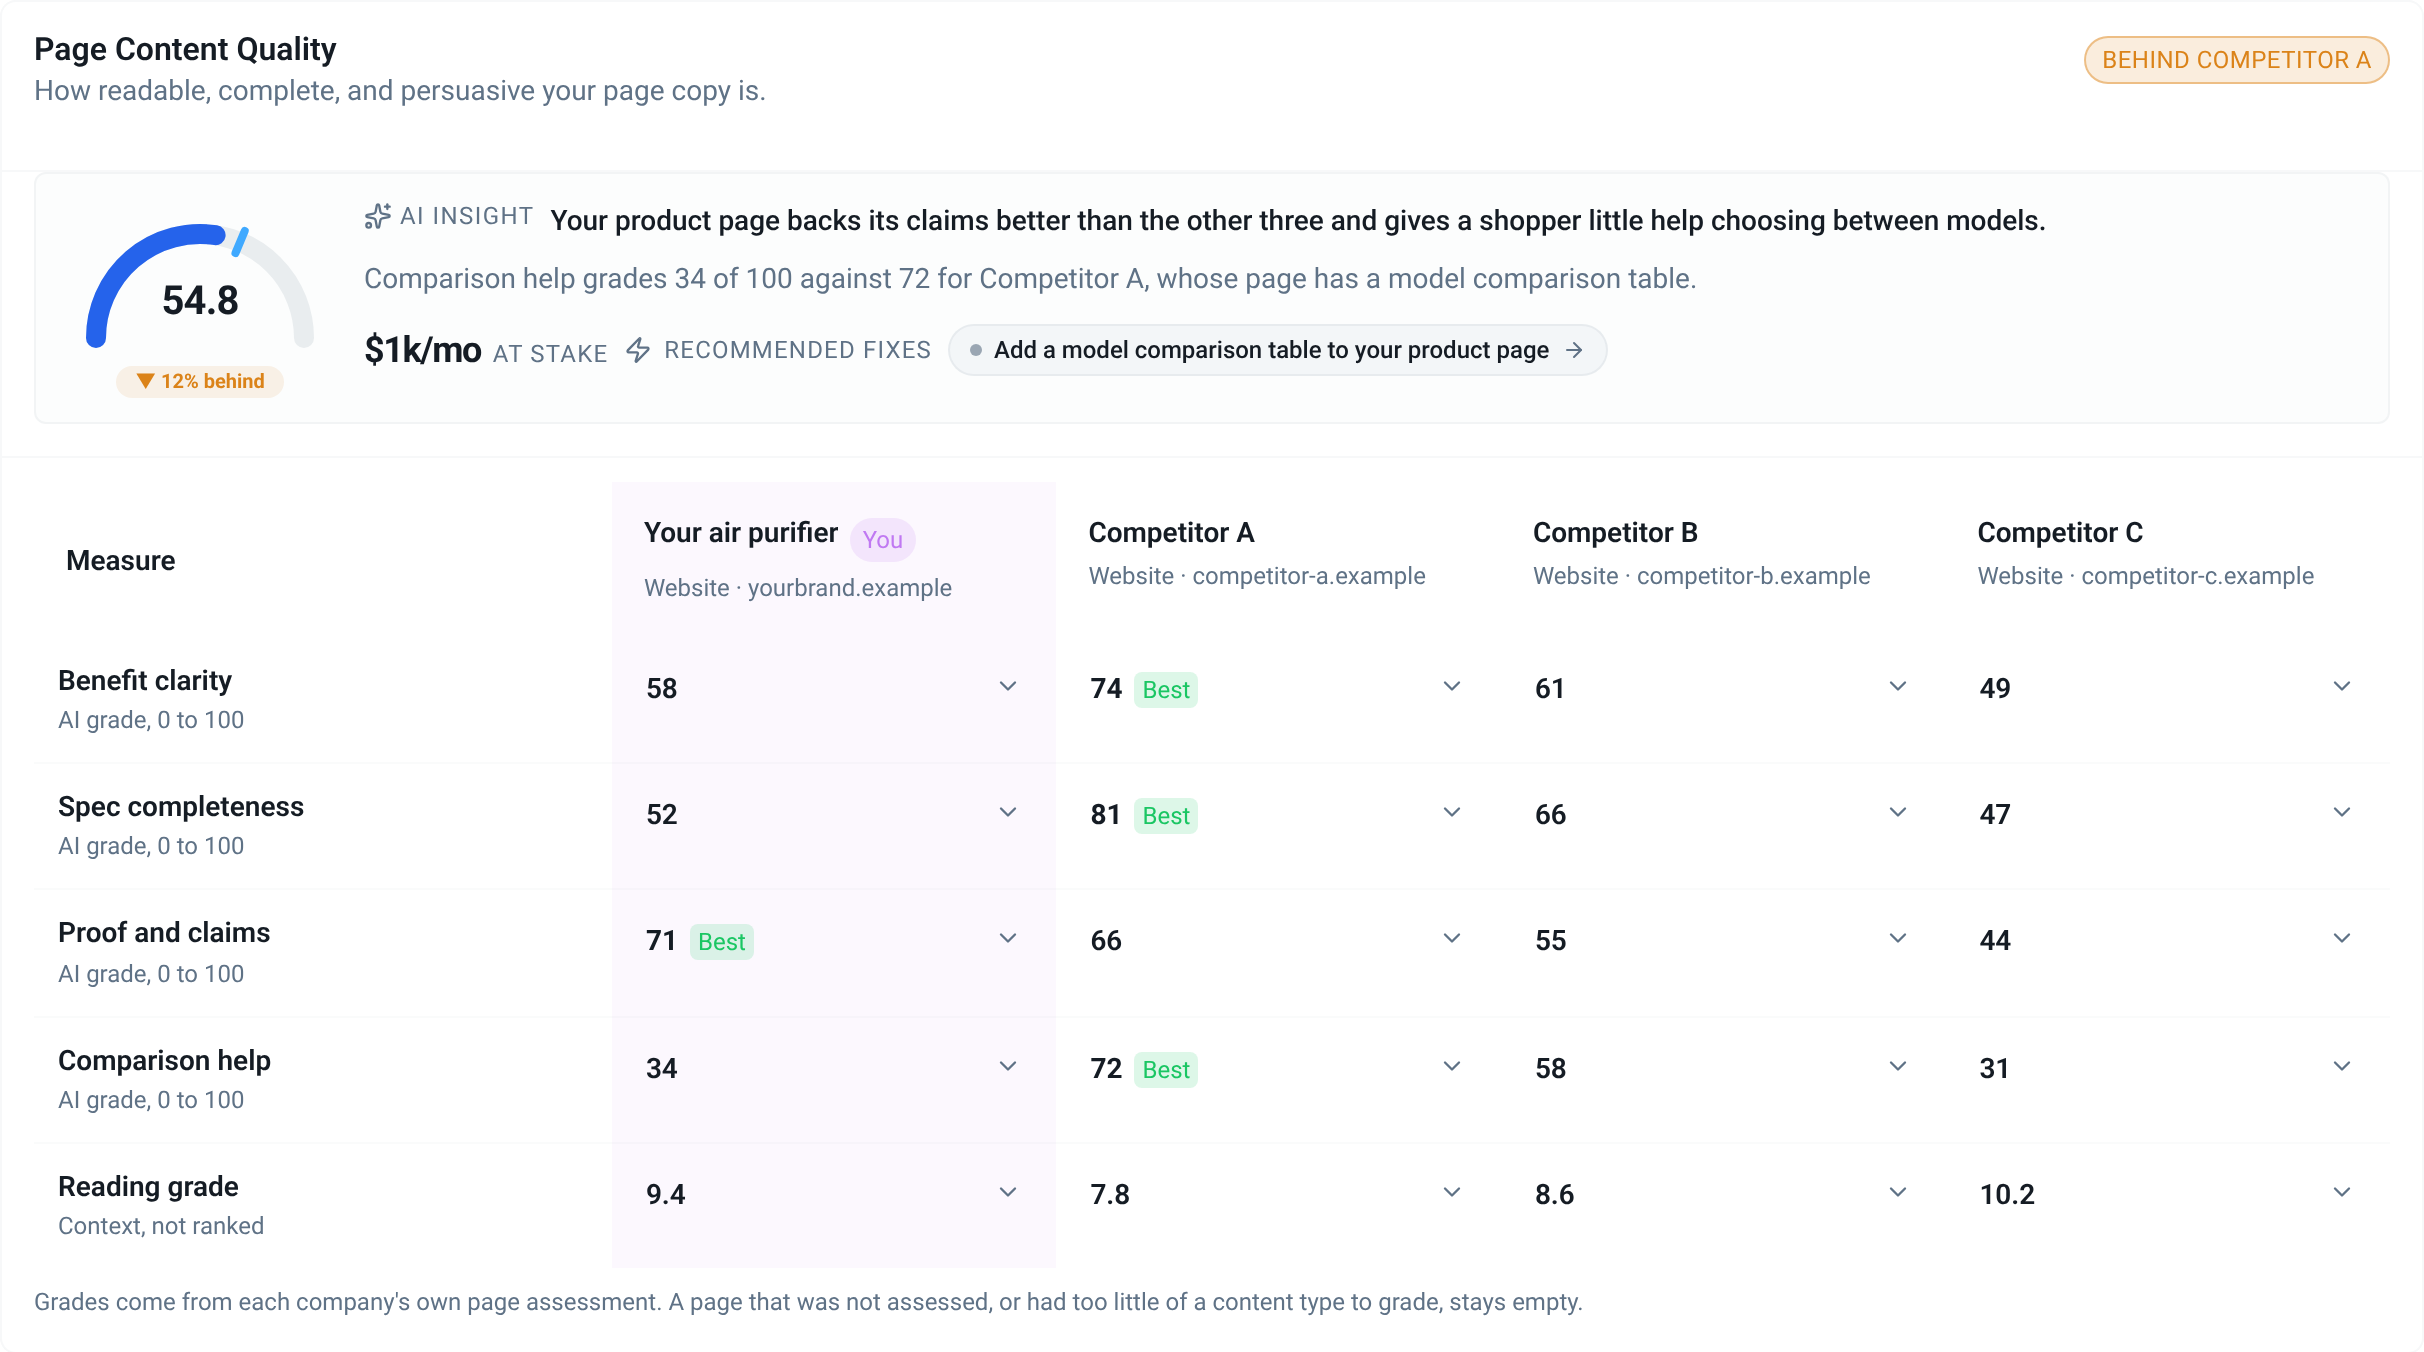
Your page backs its claims best and does little to help shoppers choose
AI grades of each brand's product page, 0 to 100. Comparison help: 34 for yours, 72 for Competitor A.
Open the full card ↗
5 of 5 · AI Visibility
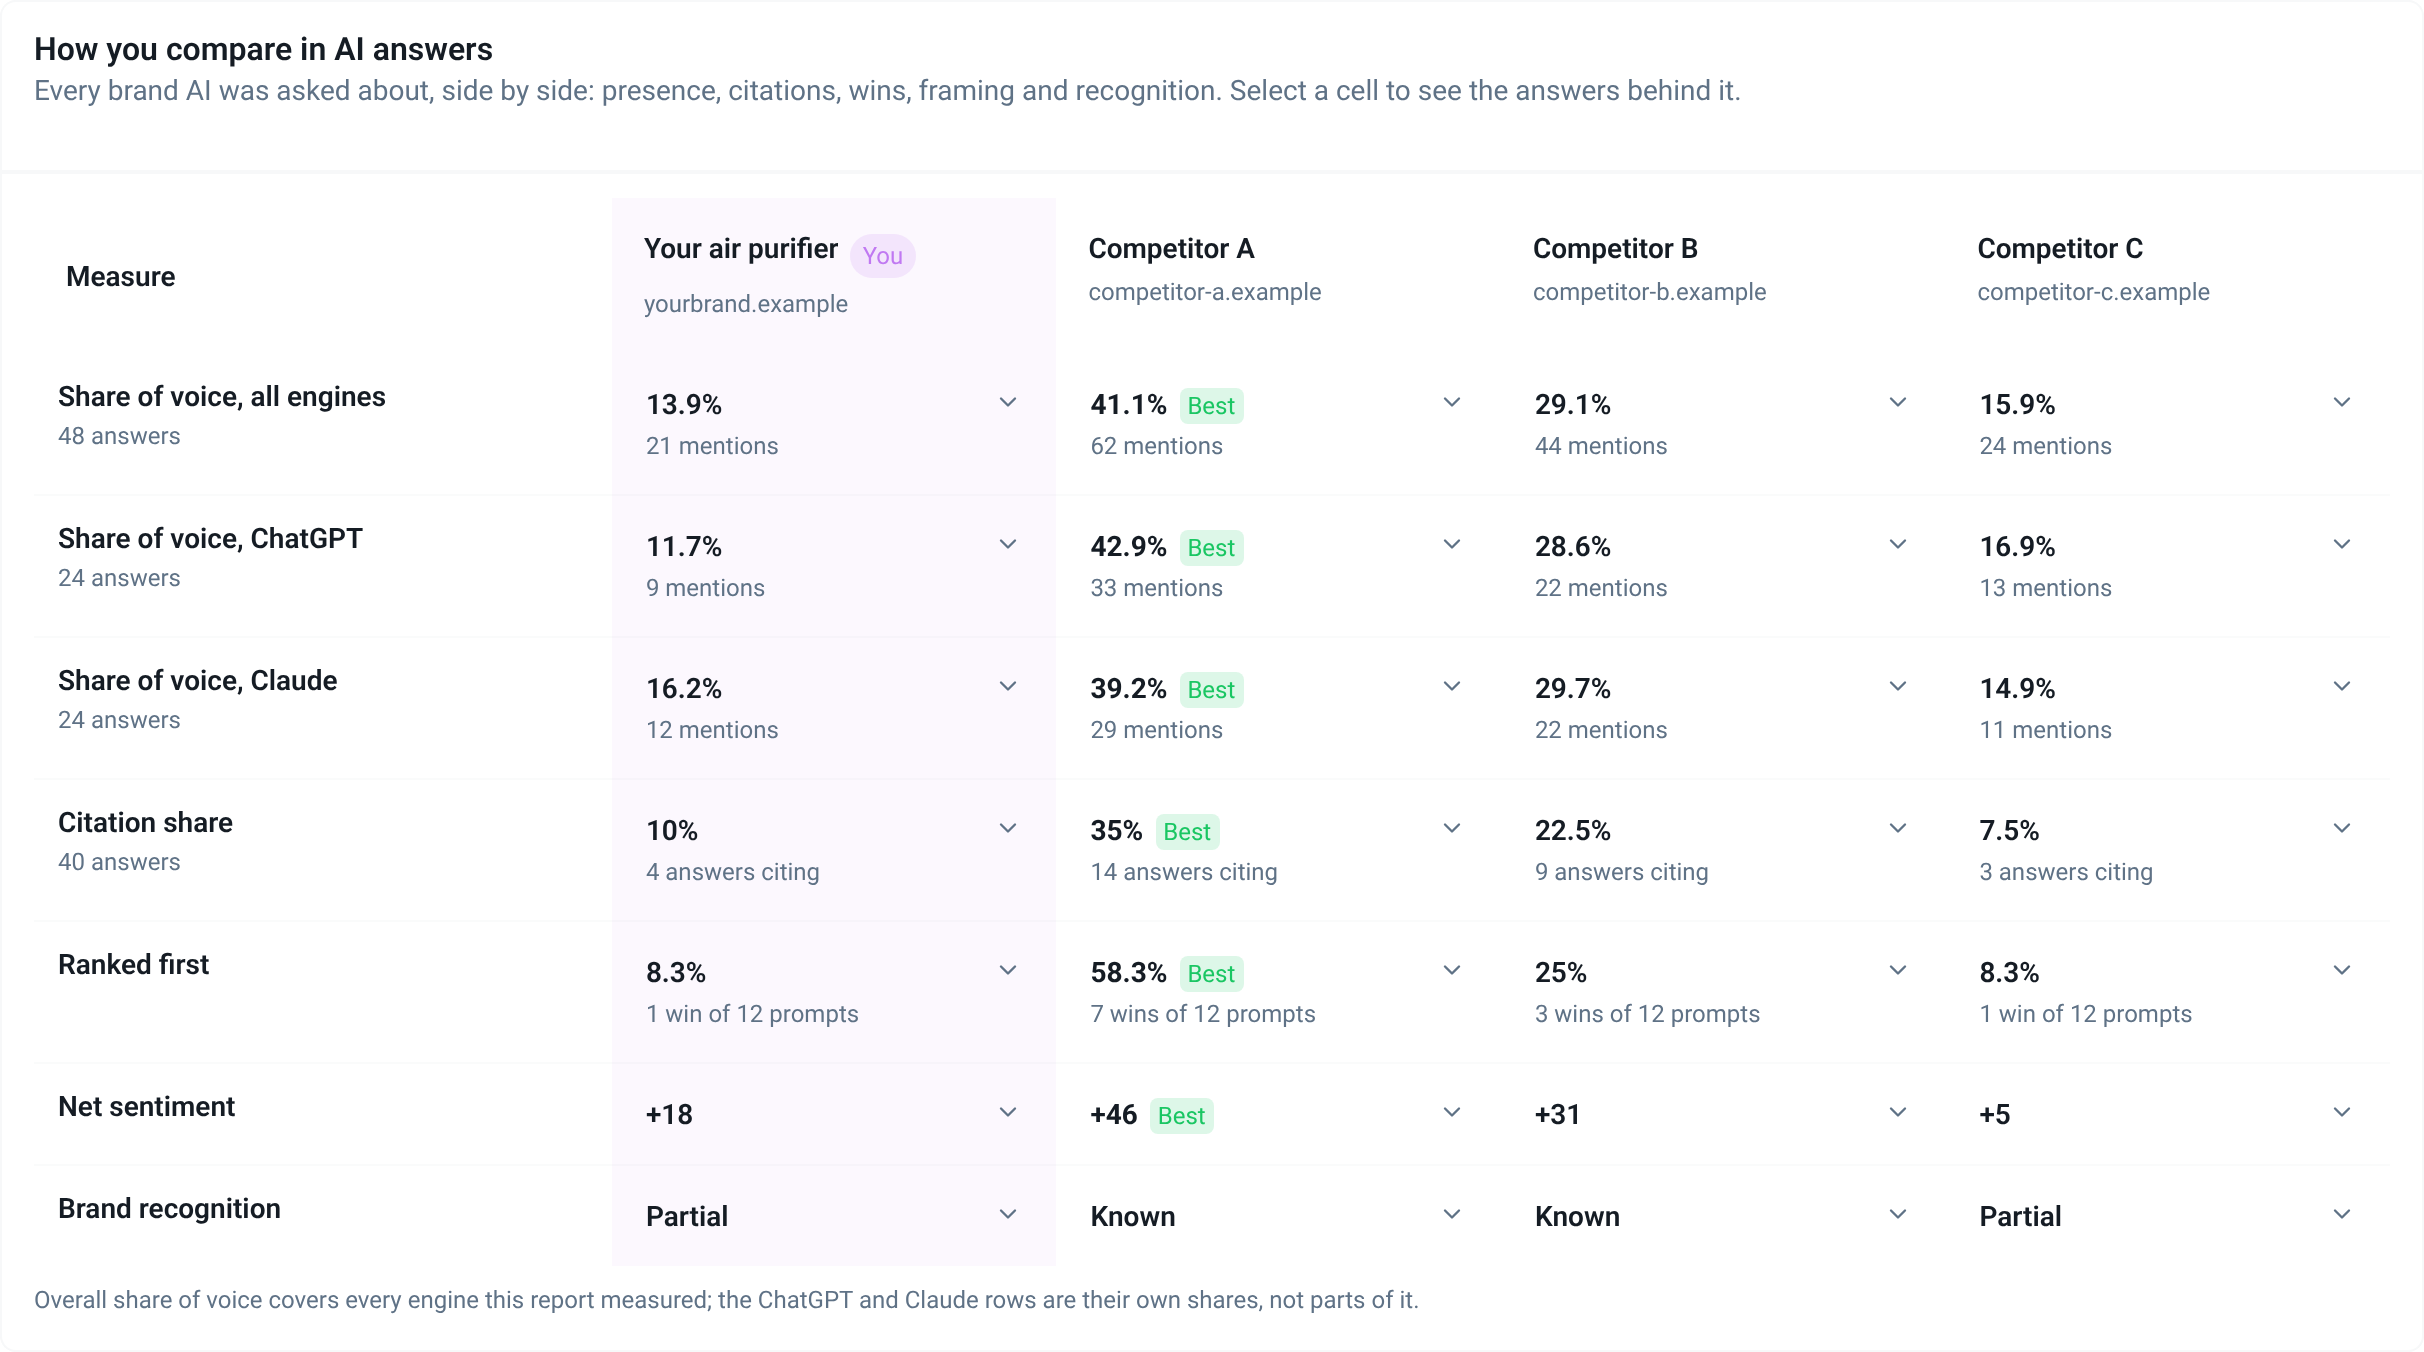
AI assistants name Competitor A three times as often
Brand mentions in 48 answers from ChatGPT and Claude to 24 buyer questions: 62 against 21.
Open the full card ↗
“% behind” compares your pillar score with Competitor A's: 58.3 against 71.2 is 18% behind. A specs row counts mentions of one spec, a review theme is wider, and the Truth Card adds listing questions, so one topic shows different counts on different cards. Each card's fixes are rows of the ranked list below.
The top fix: say what room it covers. Modeled at $5,270 a month.
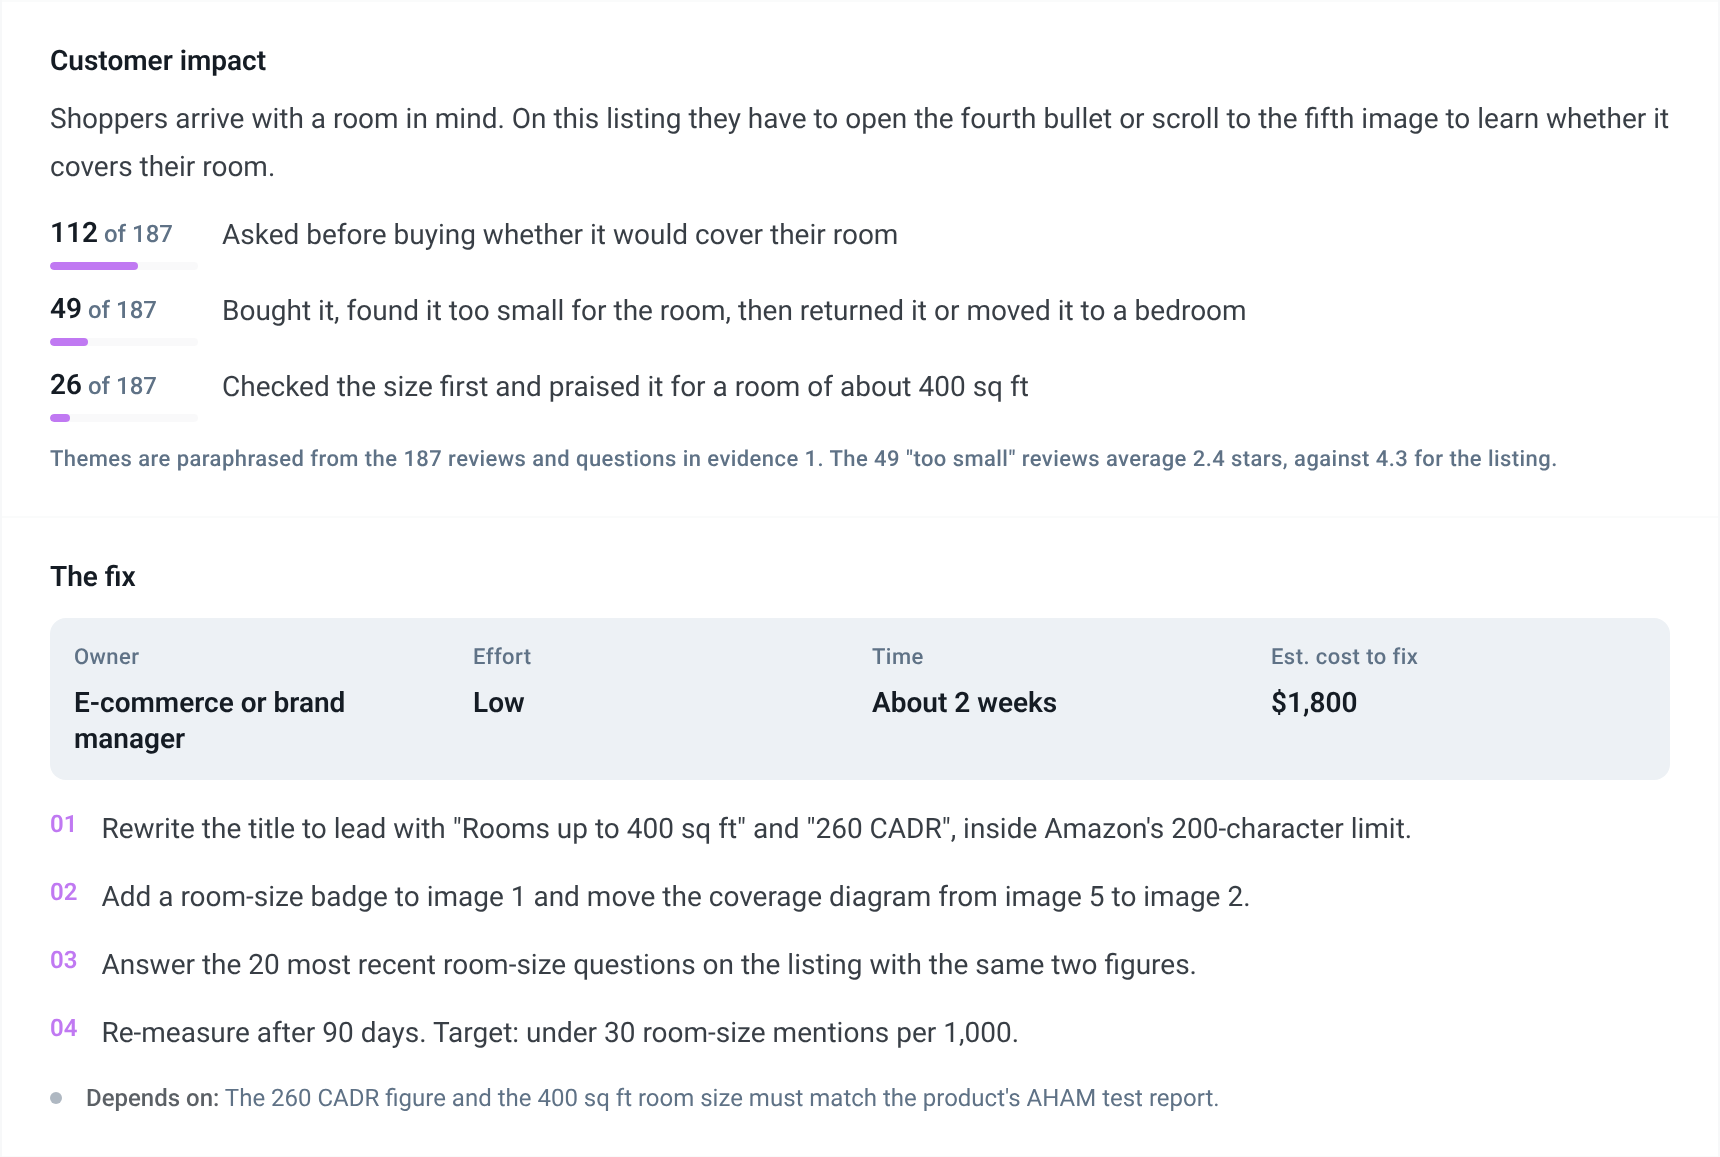
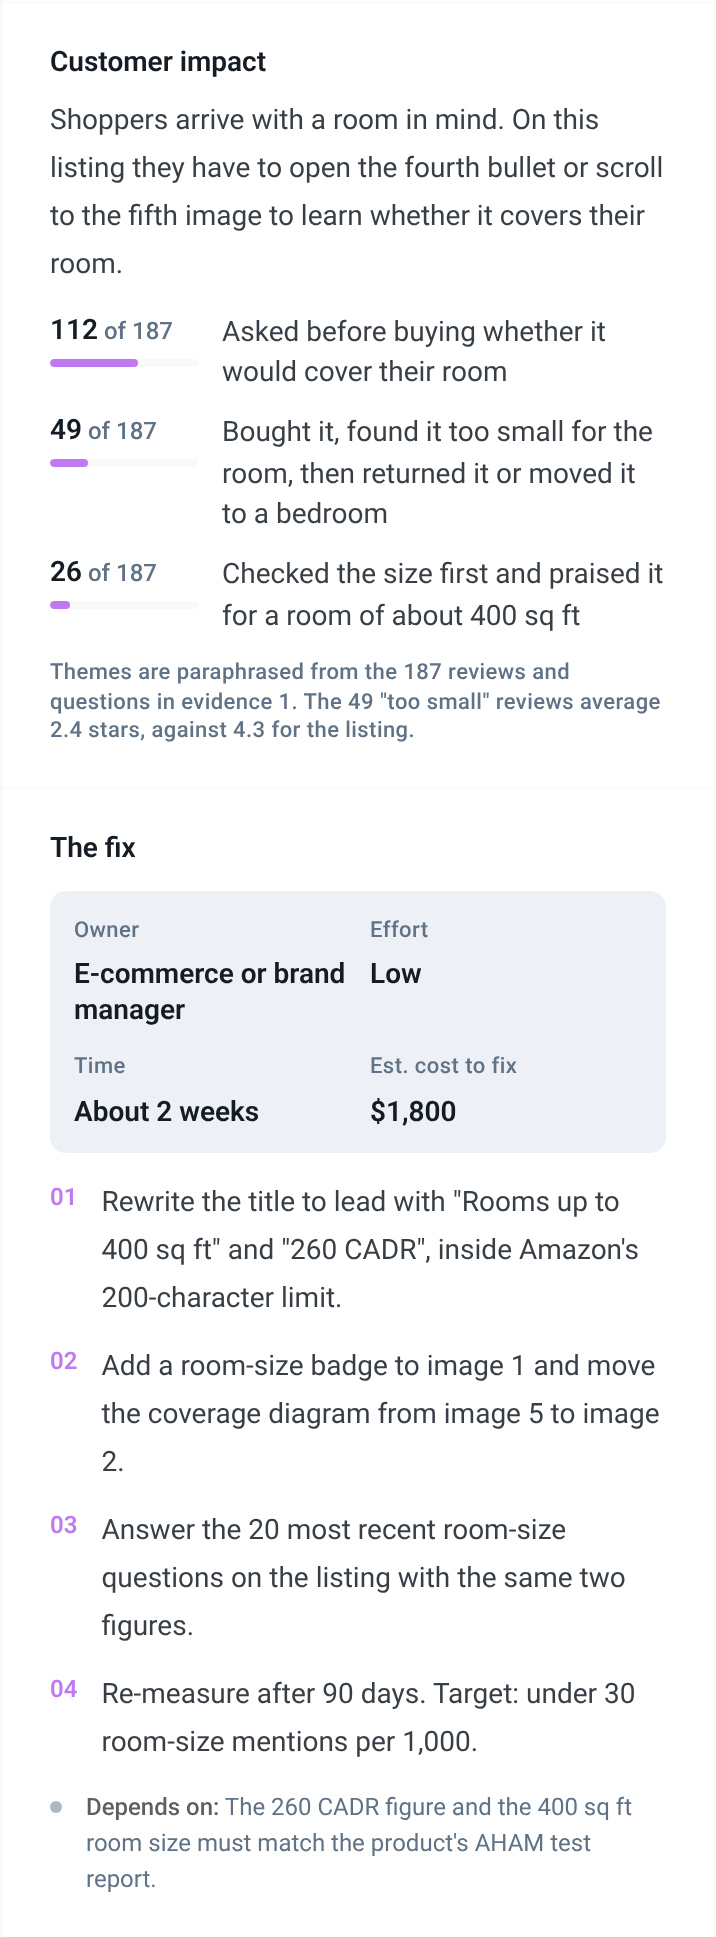
Each finding comes as a Truth Card: one gap, its evidence, the fix and a monthly figure with every input named. This is the first of ten. Room size comes up 4.6 times as often in your reviews and questions as in Competitor A's. The fix is a title and first-image edit: about two weeks and $1,800. CADR is clean air delivery rate, the airflow figure room size is worked out from.
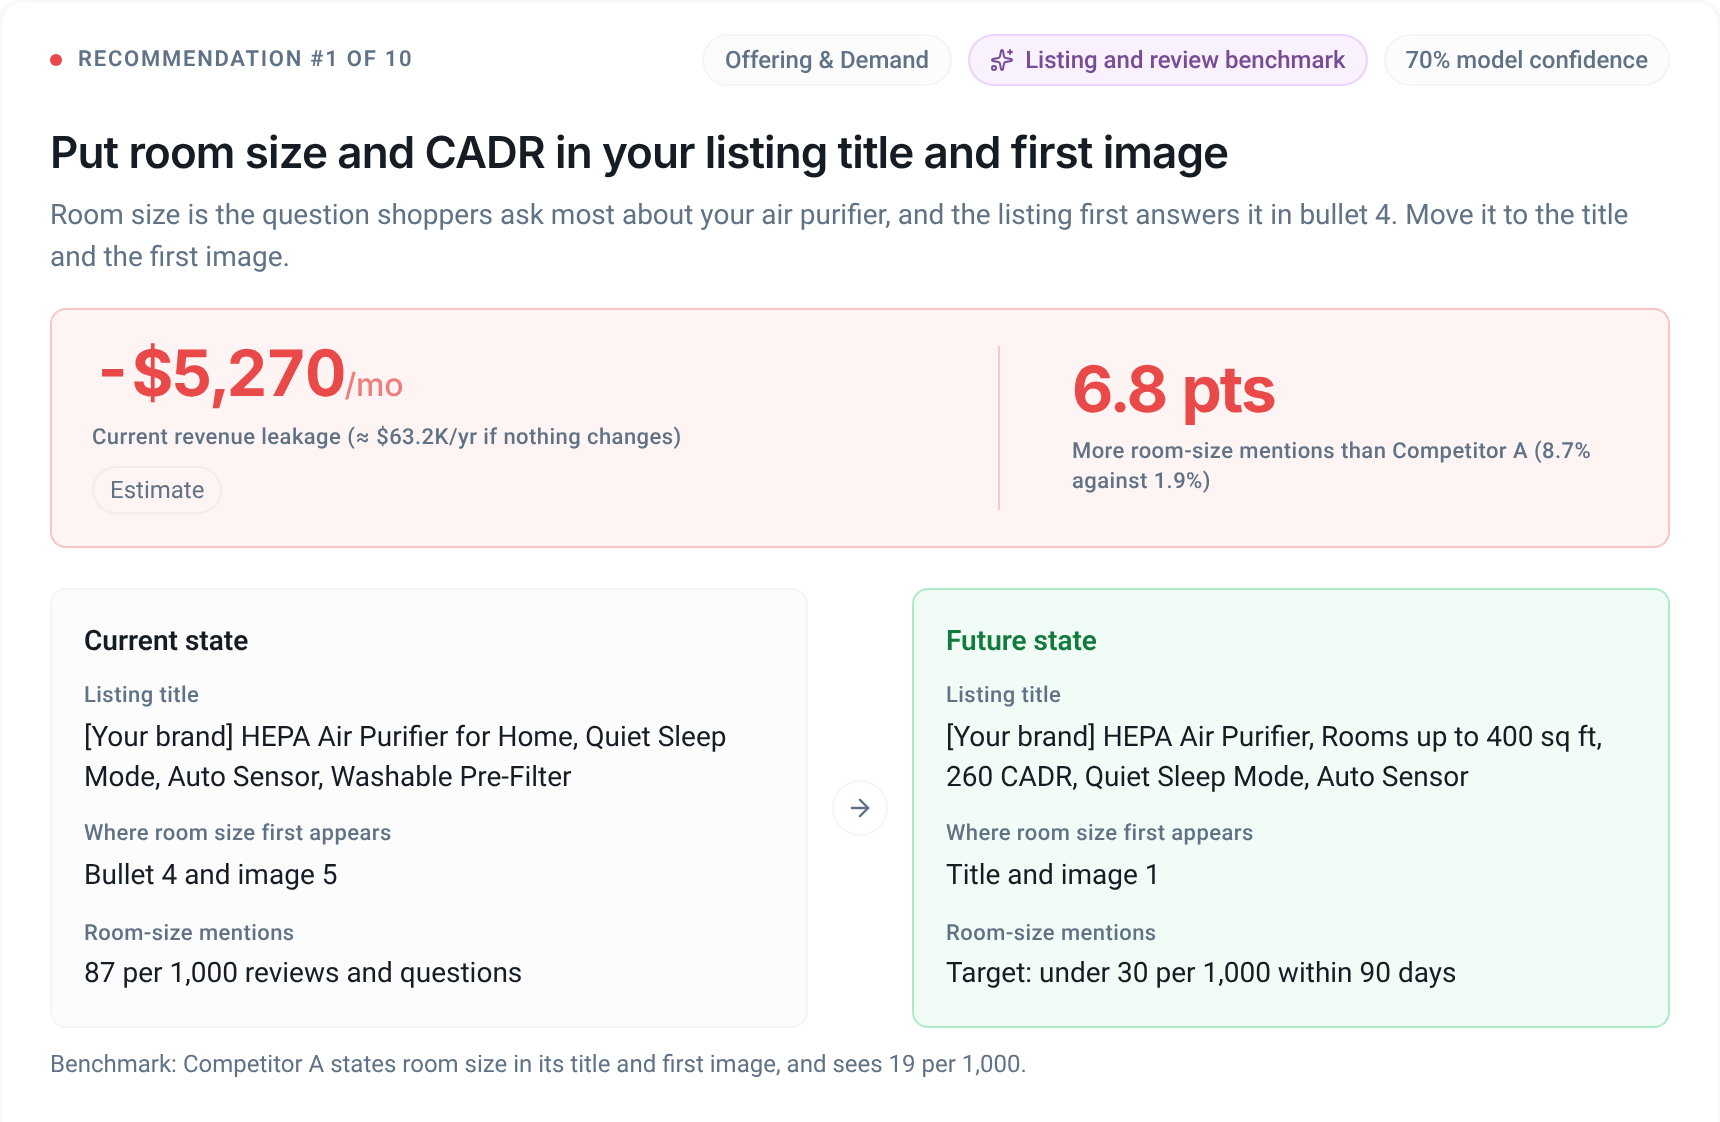
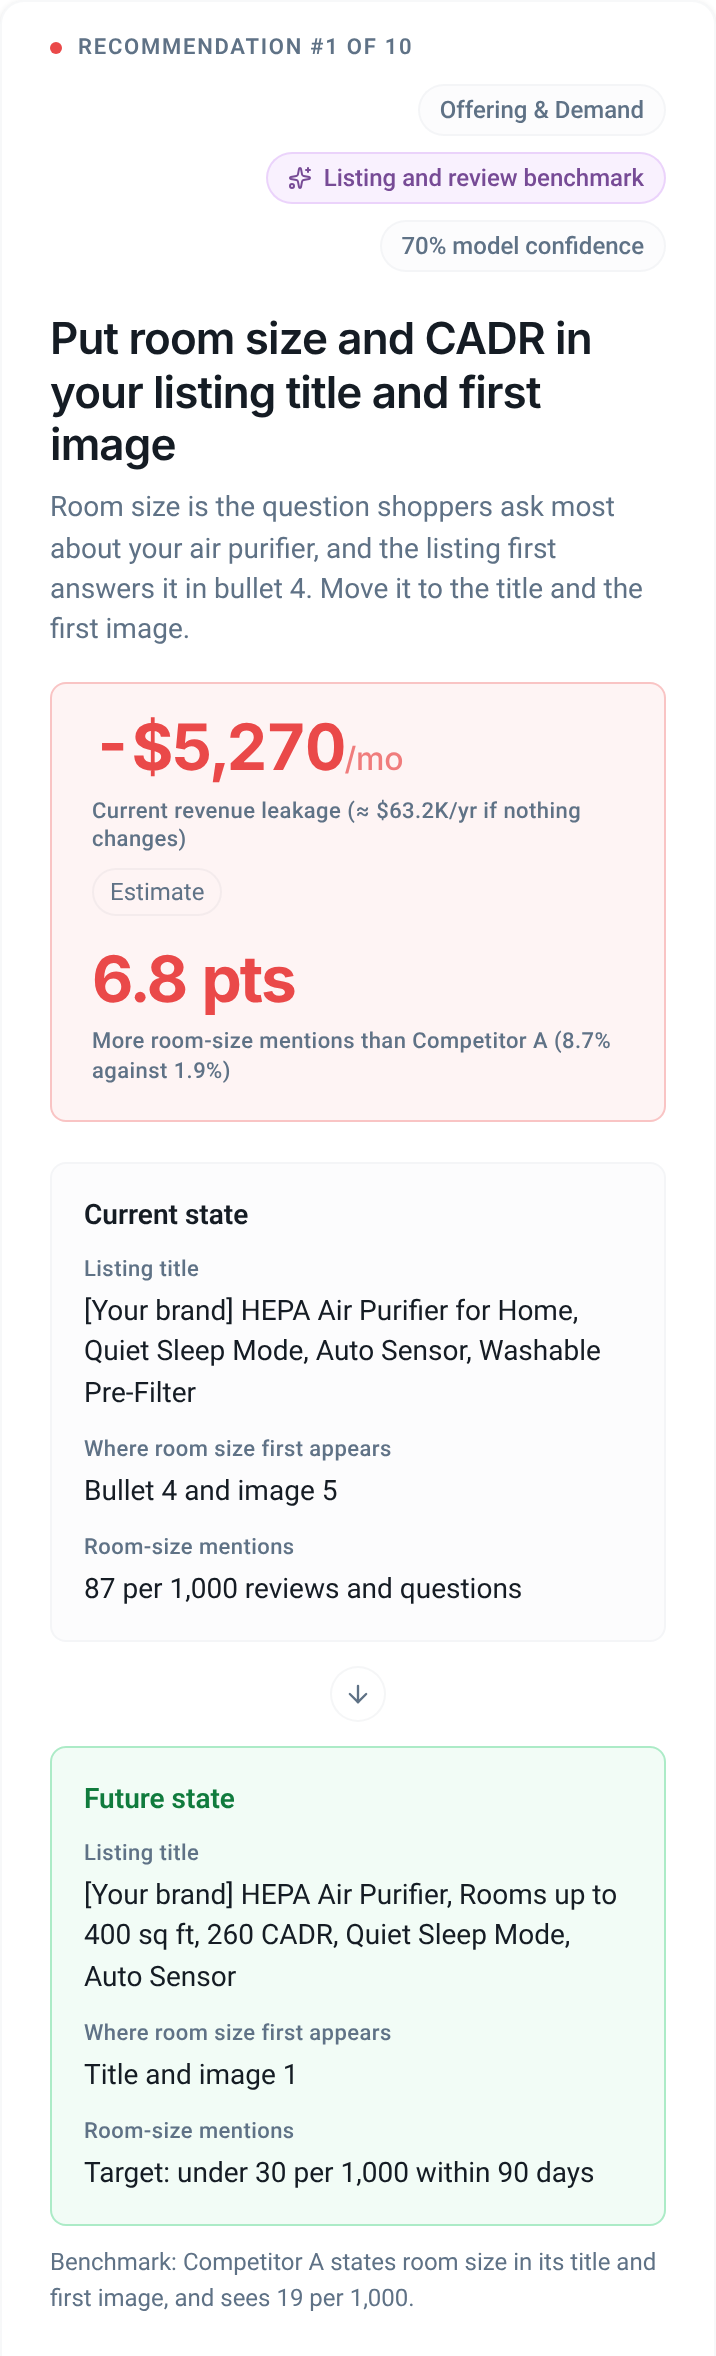
Today's title against the fixed one
What the listing says now and after the fix, beside the measured gap: 87 room-size mentions per 1,000 reviews and questions, against 19 for Competitor A.
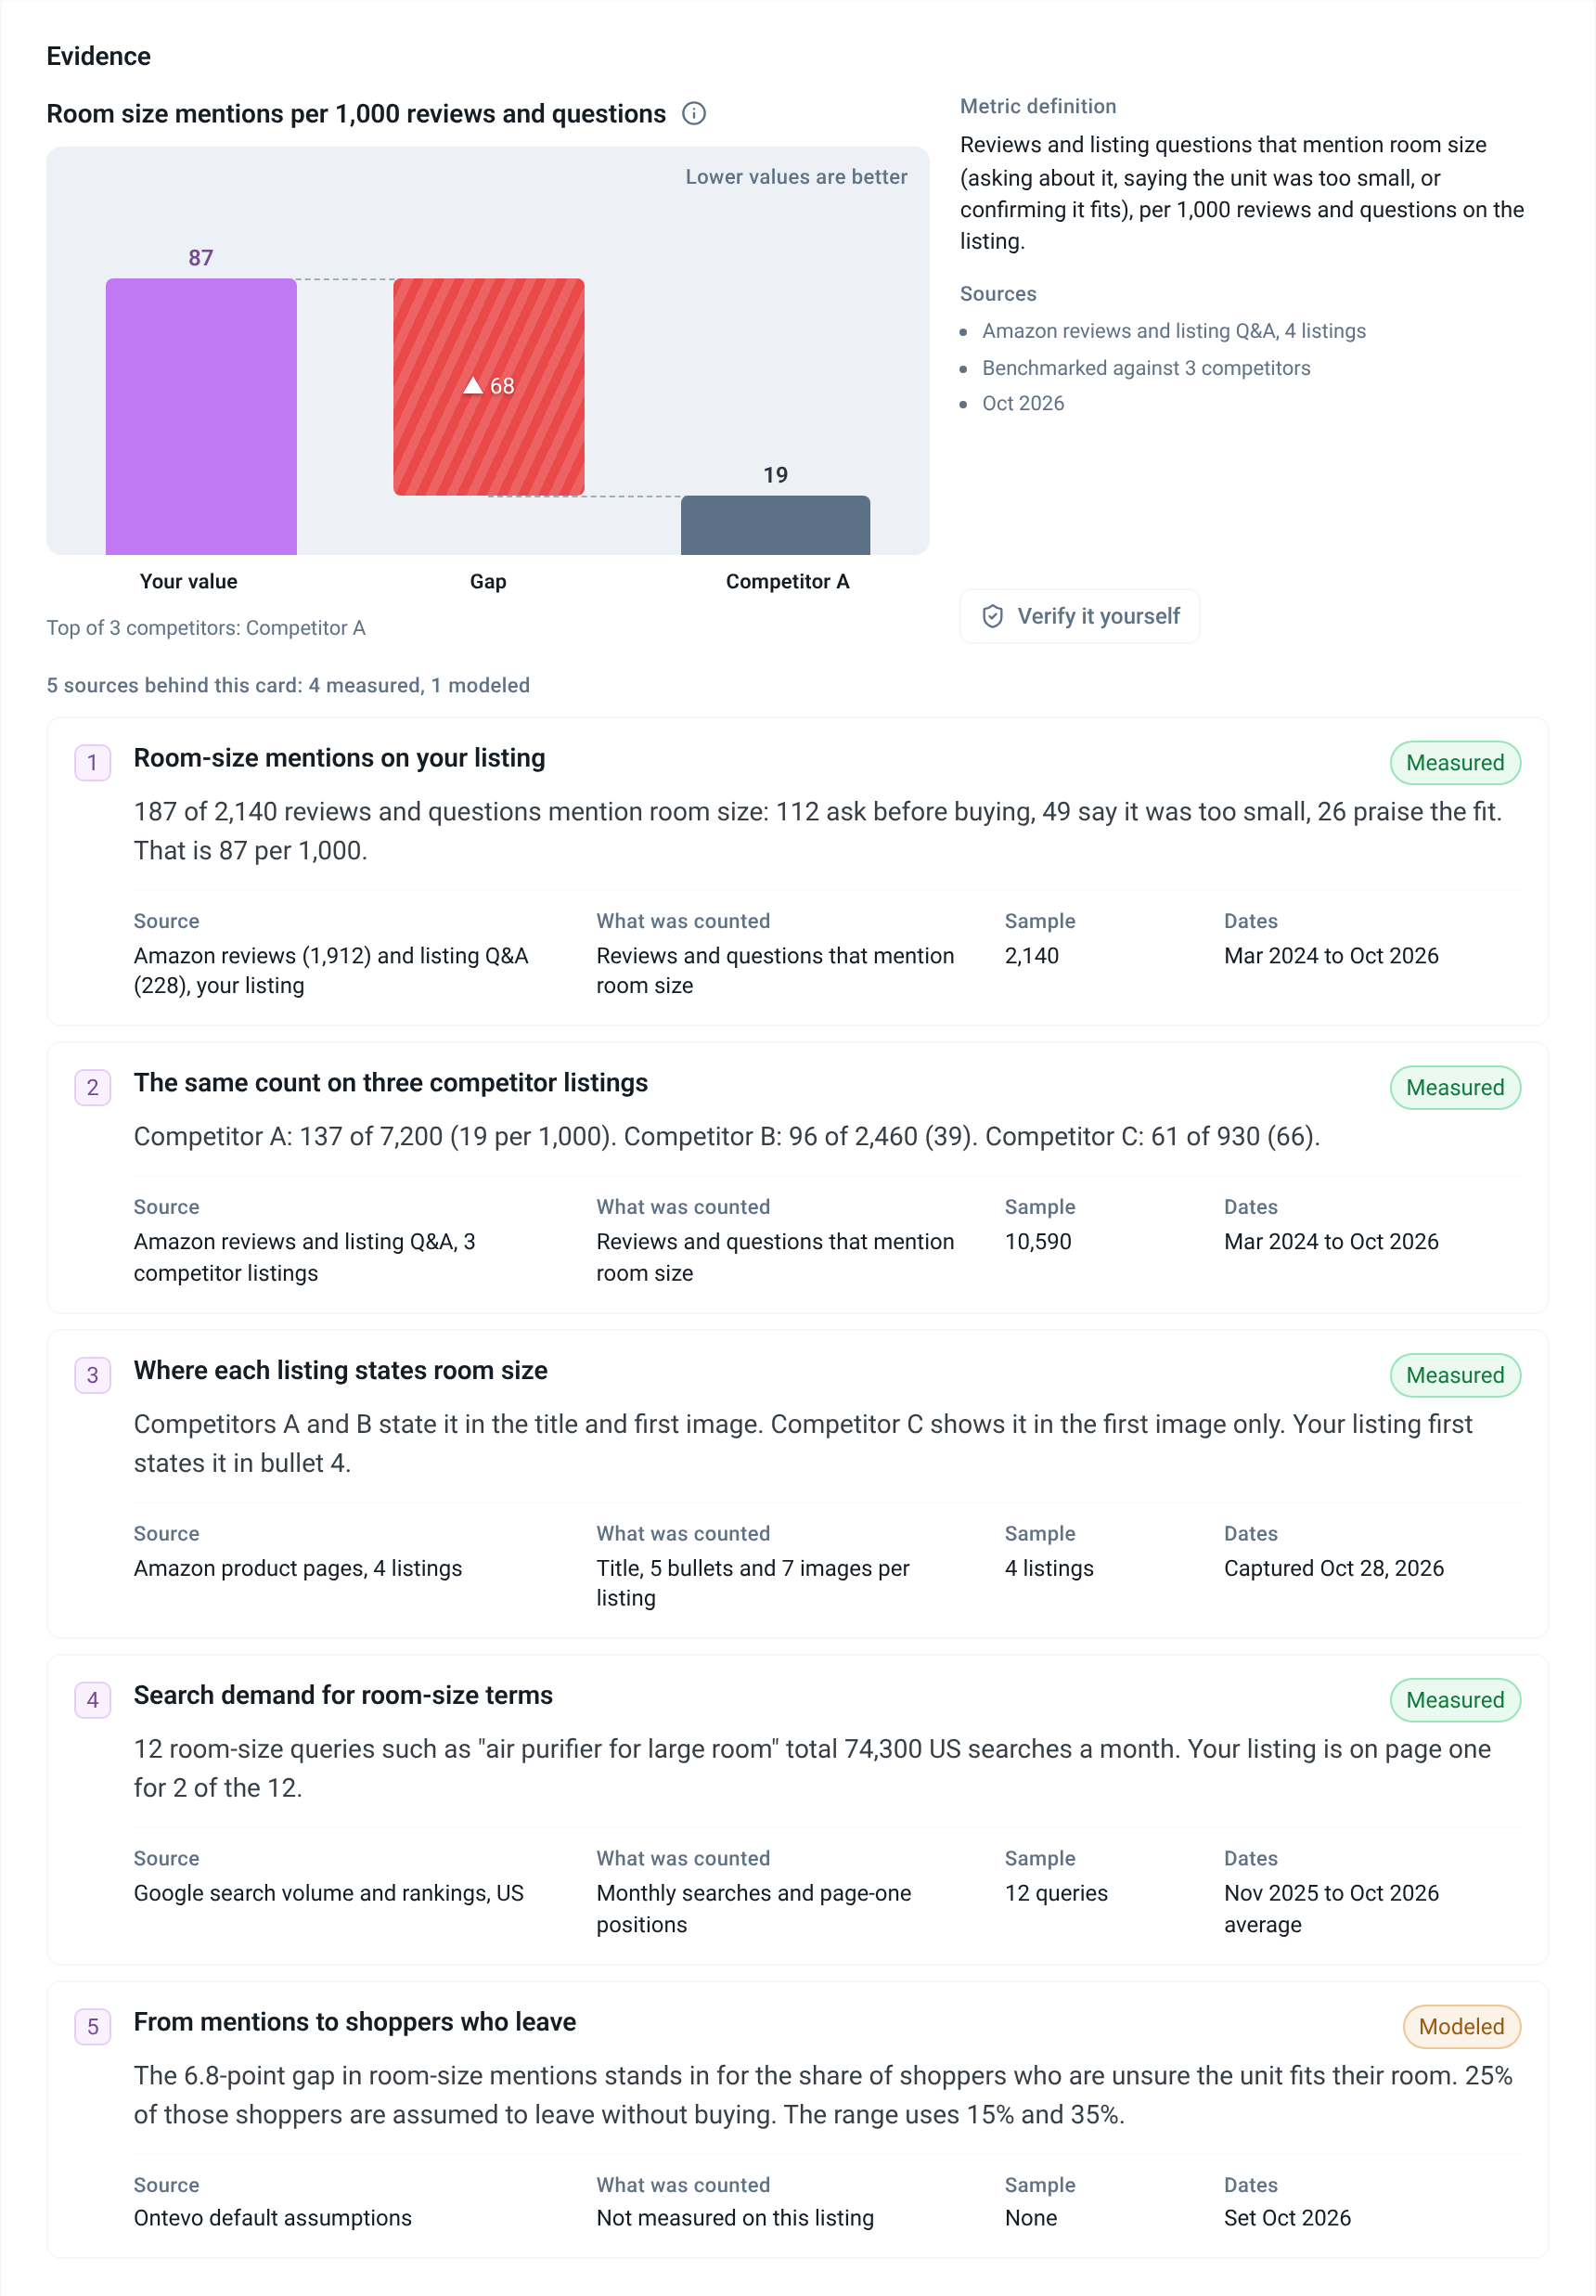

Five sources, four of them measured
Each names what was counted, the sample size and the dates: 12,730 reviews and questions, March 2024 to October 2026. The fifth holds the model's two assumptions, and the card labels it Modeled.
Tell us one product. We'll show you its Full Diagnostic, with Truth Cards like this one, in a 30-minute demo. If it's a fit, you get a one-week trial. No charge.
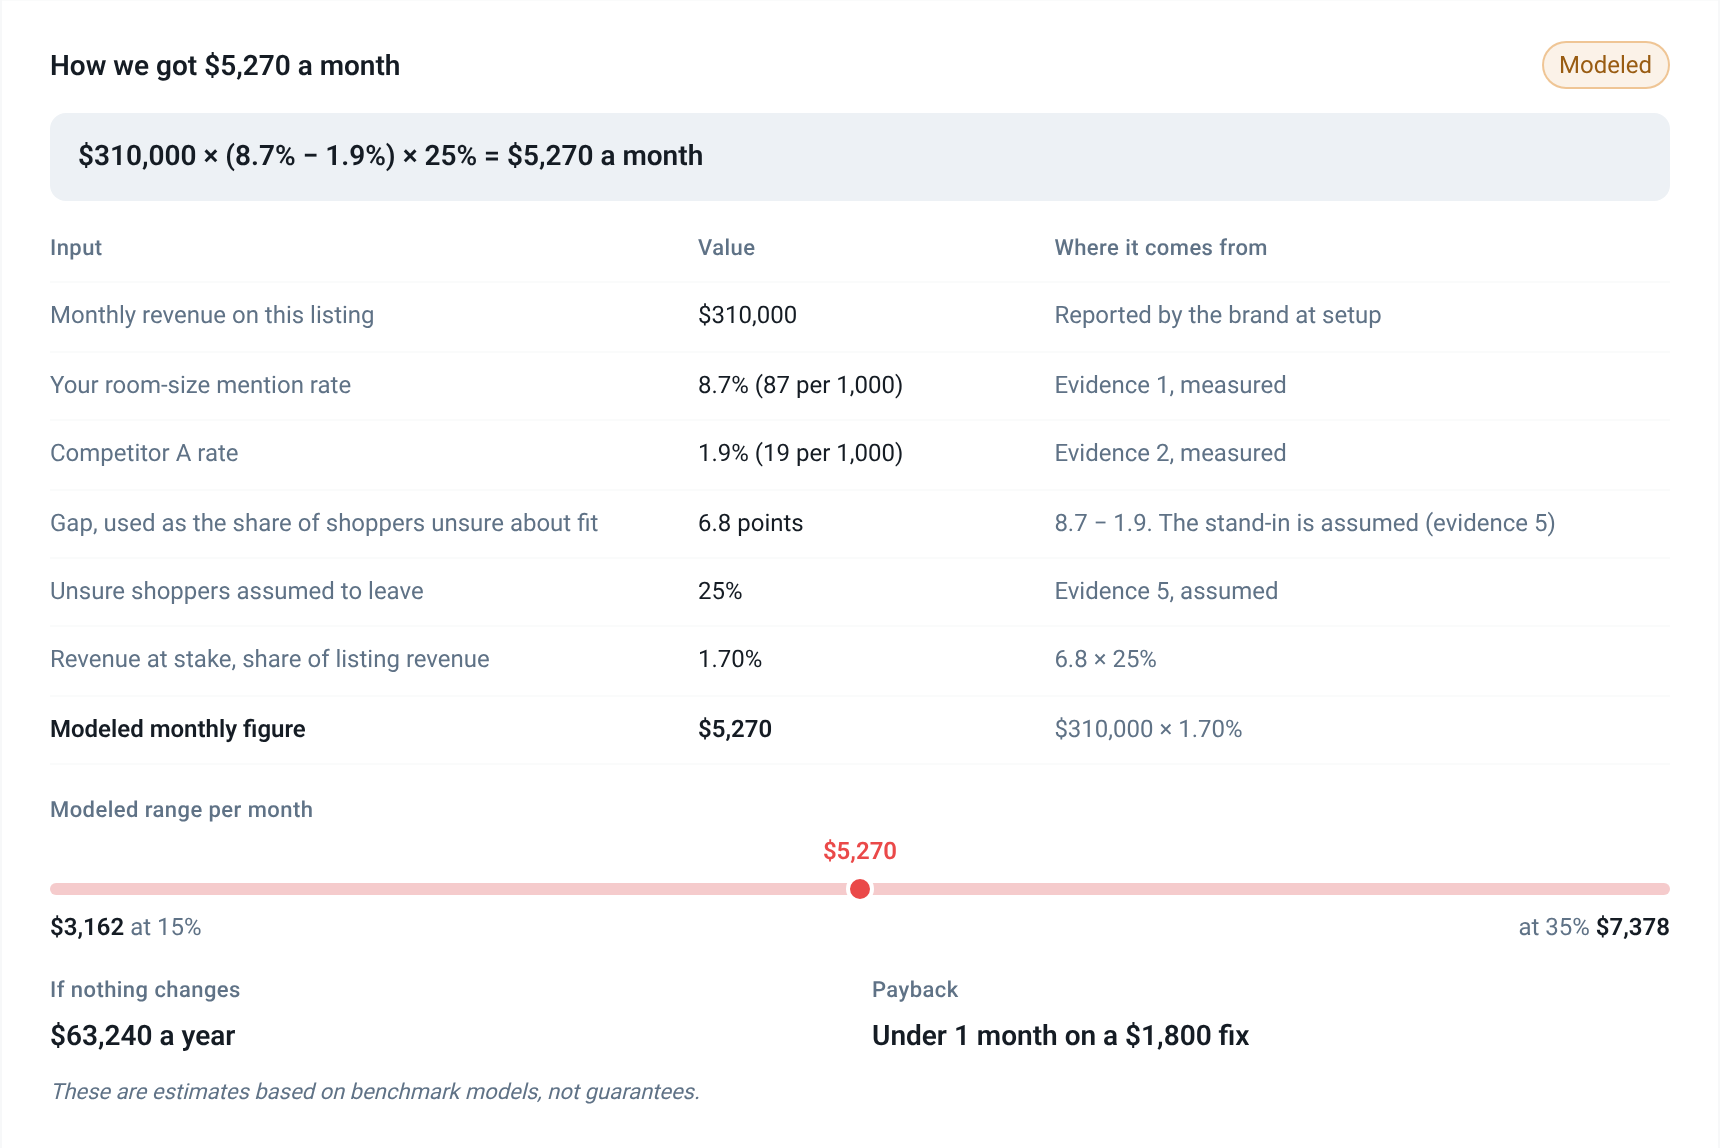
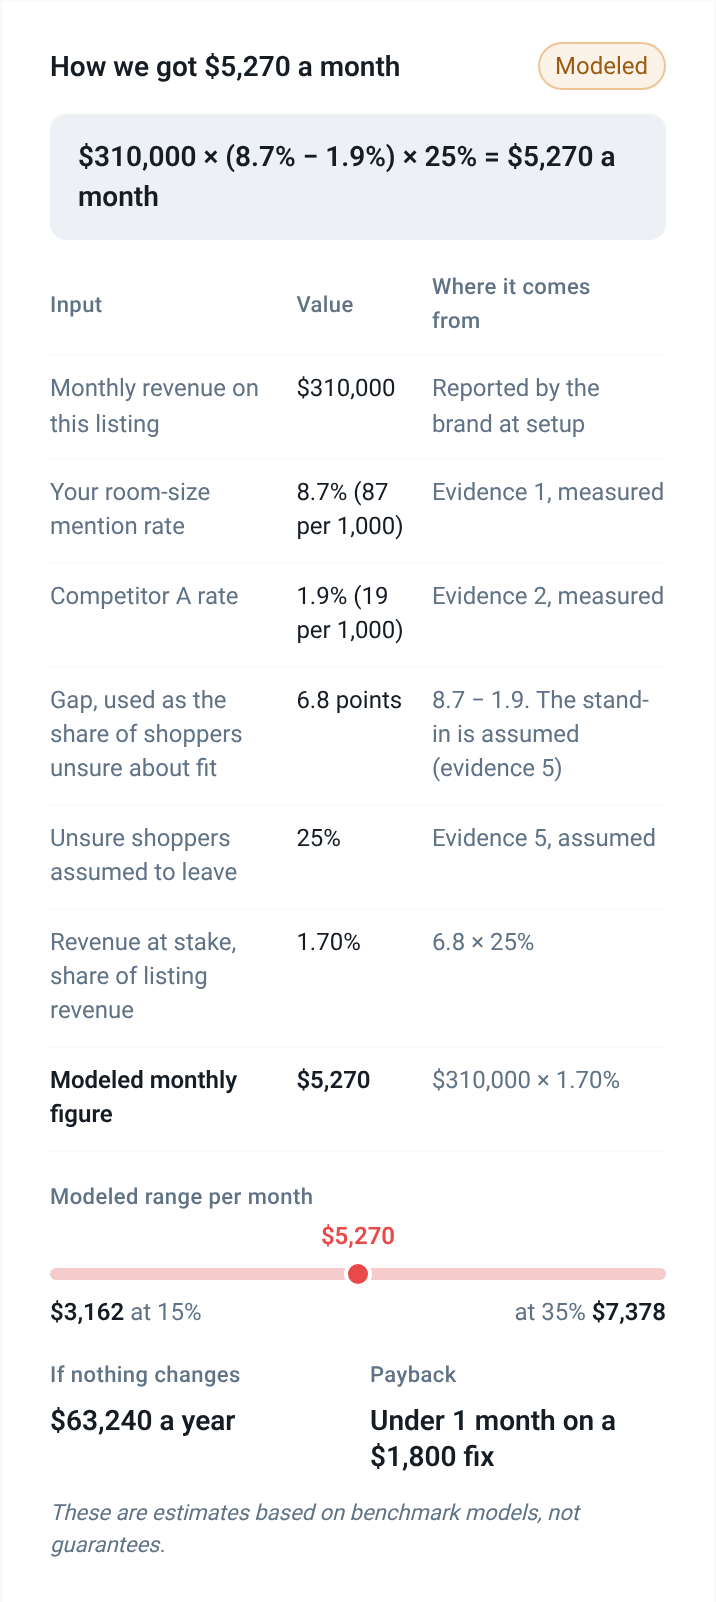
$310,000 × 6.8 points × 25% = $5,270
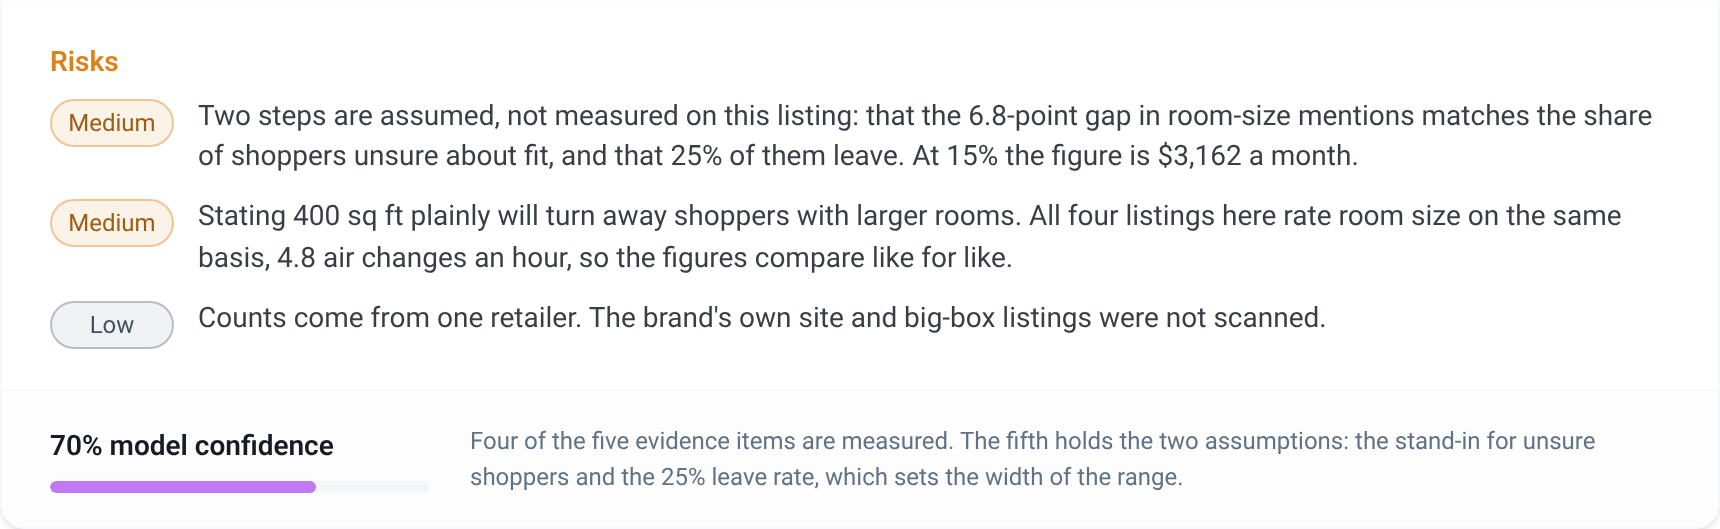
Monthly revenue on the listing, times the gap in room-size mentions (8.7% of reviews and questions against 1.9%), times 25%. The gap stands in for the share of shoppers who are unsure the unit fits their room, and a quarter of them are assumed to leave. Both steps are assumptions. If 15% to 35% leave, the figure runs from $3,162 to $7,378 a month.
Three risks, rated, and 70% confidence
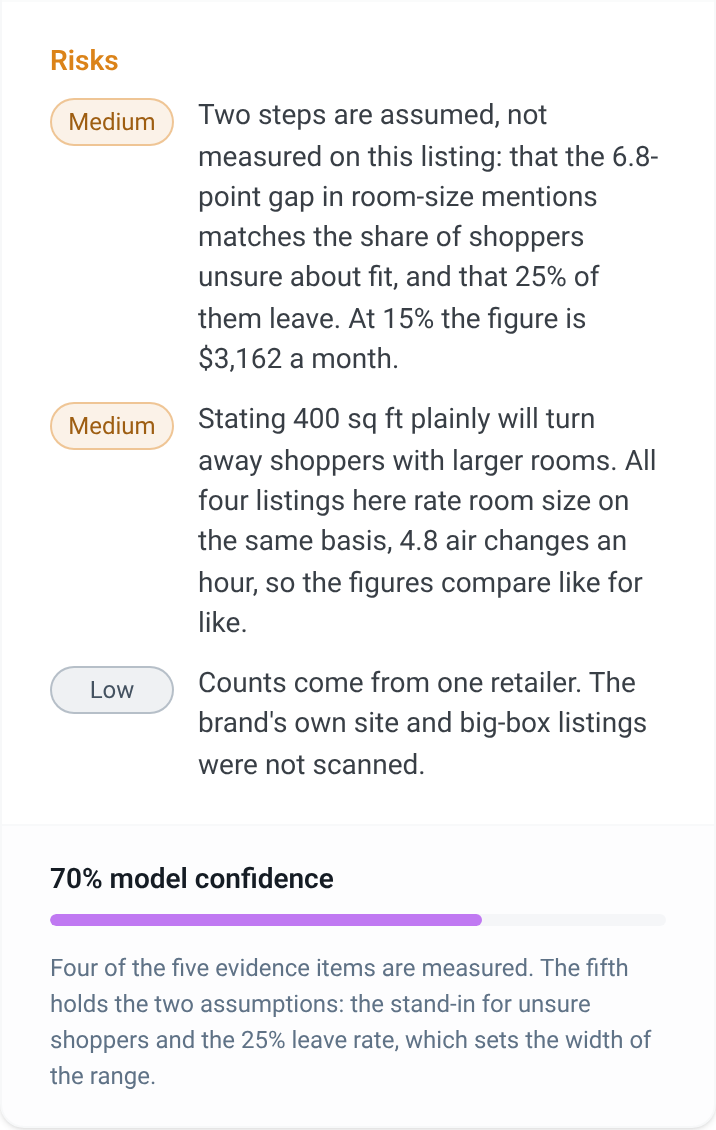
The largest: the stand-in and the 25% leave rate were assumed, not measured on this listing. At 15% the figure drops to $3,162 a month.
Ten fixes, each modeled on its own. The four low-effort ones come to $12,400 a month.
Ranked by modeled revenue. The Truth Card above is row 1, and every row opens a card like it. The ten sum to $23,870 a month, but fixes aimed at the same shoppers overlap (rows 1, 7 and 10 all chase room-size shoppers), so read the sum as a ceiling, not a forecast.
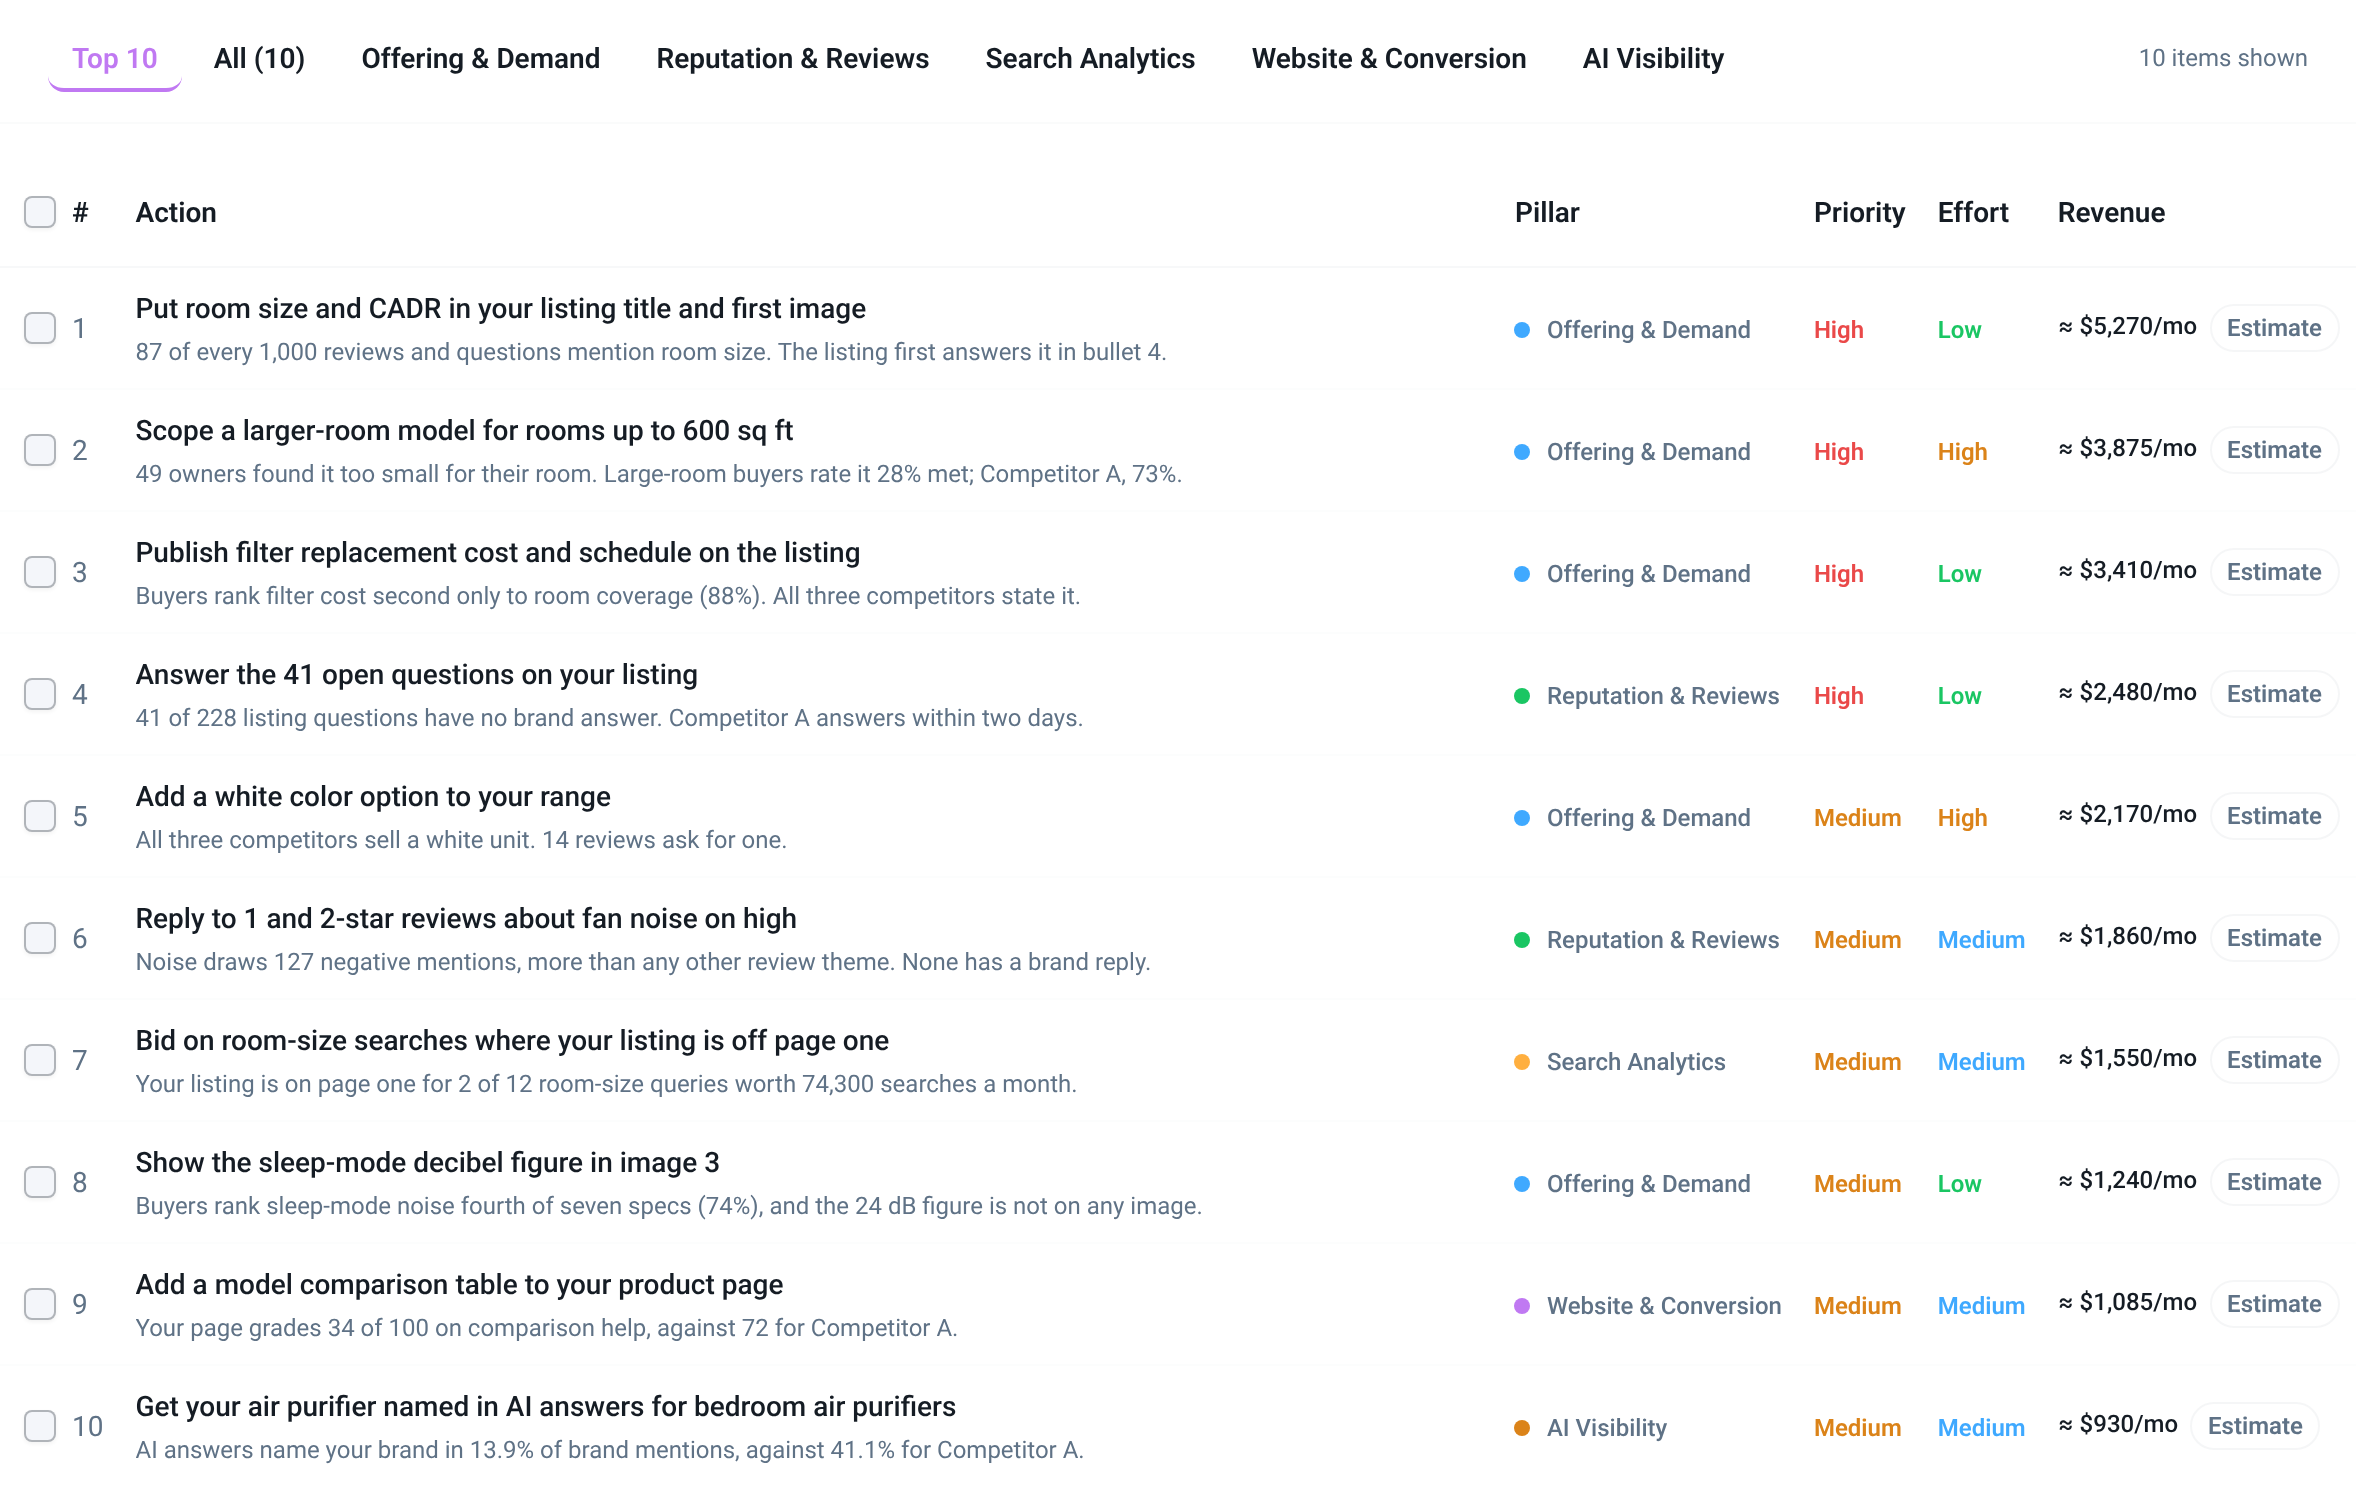
1. Put room size and CADR in your listing title and first image
≈ $5,270/mo
2. Scope a larger-room model for rooms up to 600 sq ft
≈ $3,875/mo
3. Publish filter replacement cost and schedule on the listing
≈ $3,410/mo
4. Answer the 41 open questions on your listing
≈ $2,480/mo
5. Add a white color option to your range
≈ $2,170/mo
6. Reply to 1 and 2-star reviews about fan noise on high
≈ $1,860/mo
7. Bid on room-size searches where your listing is off page one
≈ $1,550/mo
8. Show the sleep-mode decibel figure in image 3
≈ $1,240/mo
9. Add a model comparison table to your product page
≈ $1,085/mo
10. Get your air purifier named in AI answers for bedroom air purifiers
≈ $930/mo
Next product: a model for rooms up to 600 sq ft. Four of six simulated large-room buyers chose it.
The listing fix recovers shoppers whose room the unit already covers. It does nothing for the 49 owners who found it too small, or for large-room buyers, who rate it 28% met against 73% for Competitor A. That is row 2 of the list. Concept Studio drafted the product and Customer Simulation tested it.
How row 2 is modeled. 49 of your 1,912 reviews (2.6%) say the unit was too small for the room. For Competitor A it is 8 of 6,480 (0.1%). The 2.5-point gap stands in for the share of your sales going to rooms the unit cannot cover, and a larger-room model is assumed to keep half of them: $310,000 × 2.5% × 50% = $3,875 a month, at 60% model confidence. It counts owners, not shoppers who leave before buying, so it does not overlap row 1.
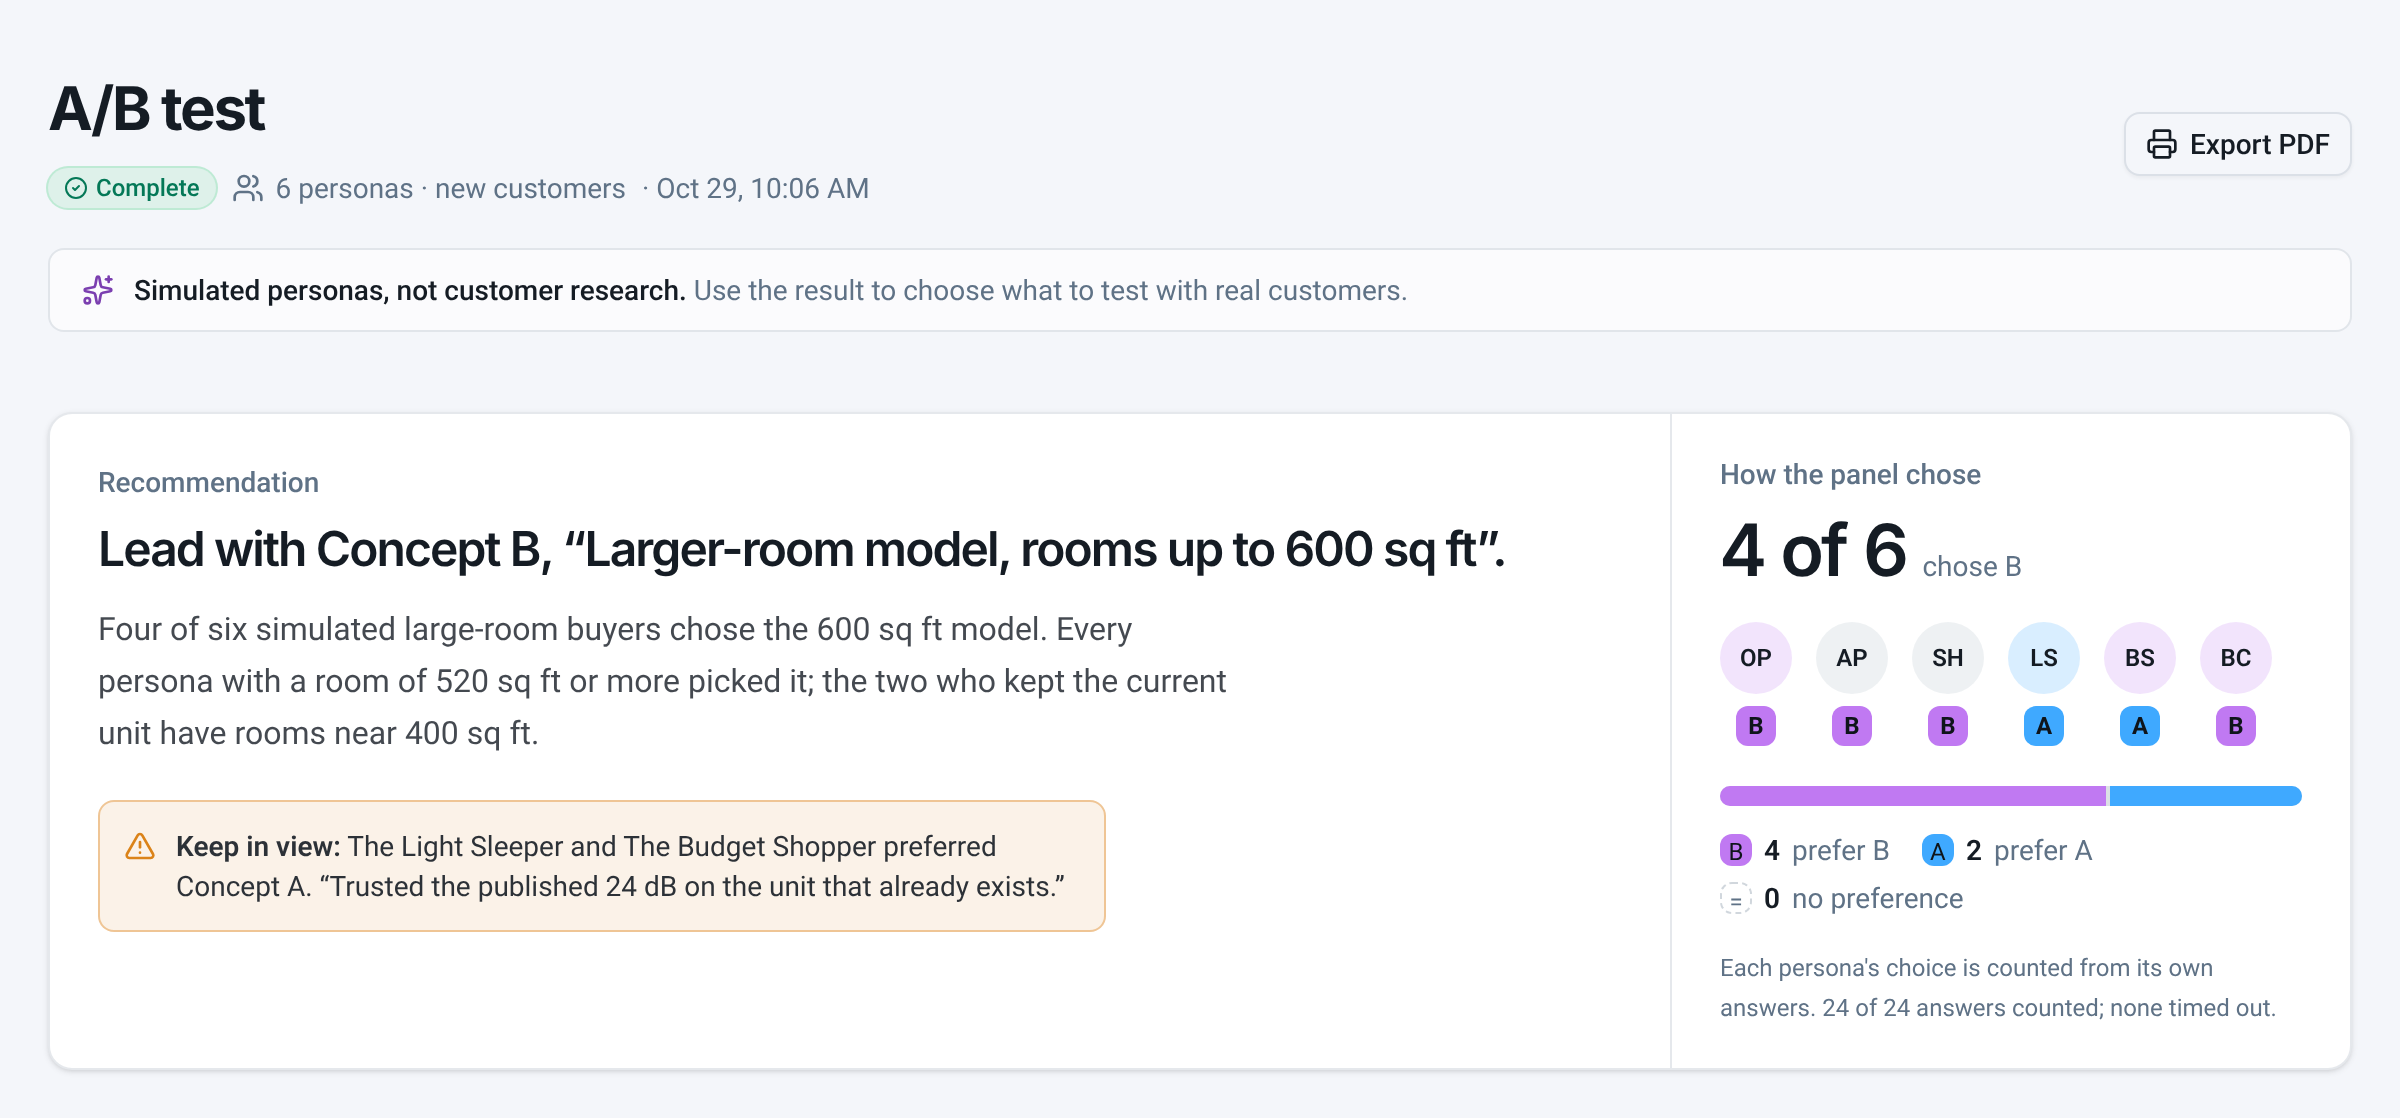
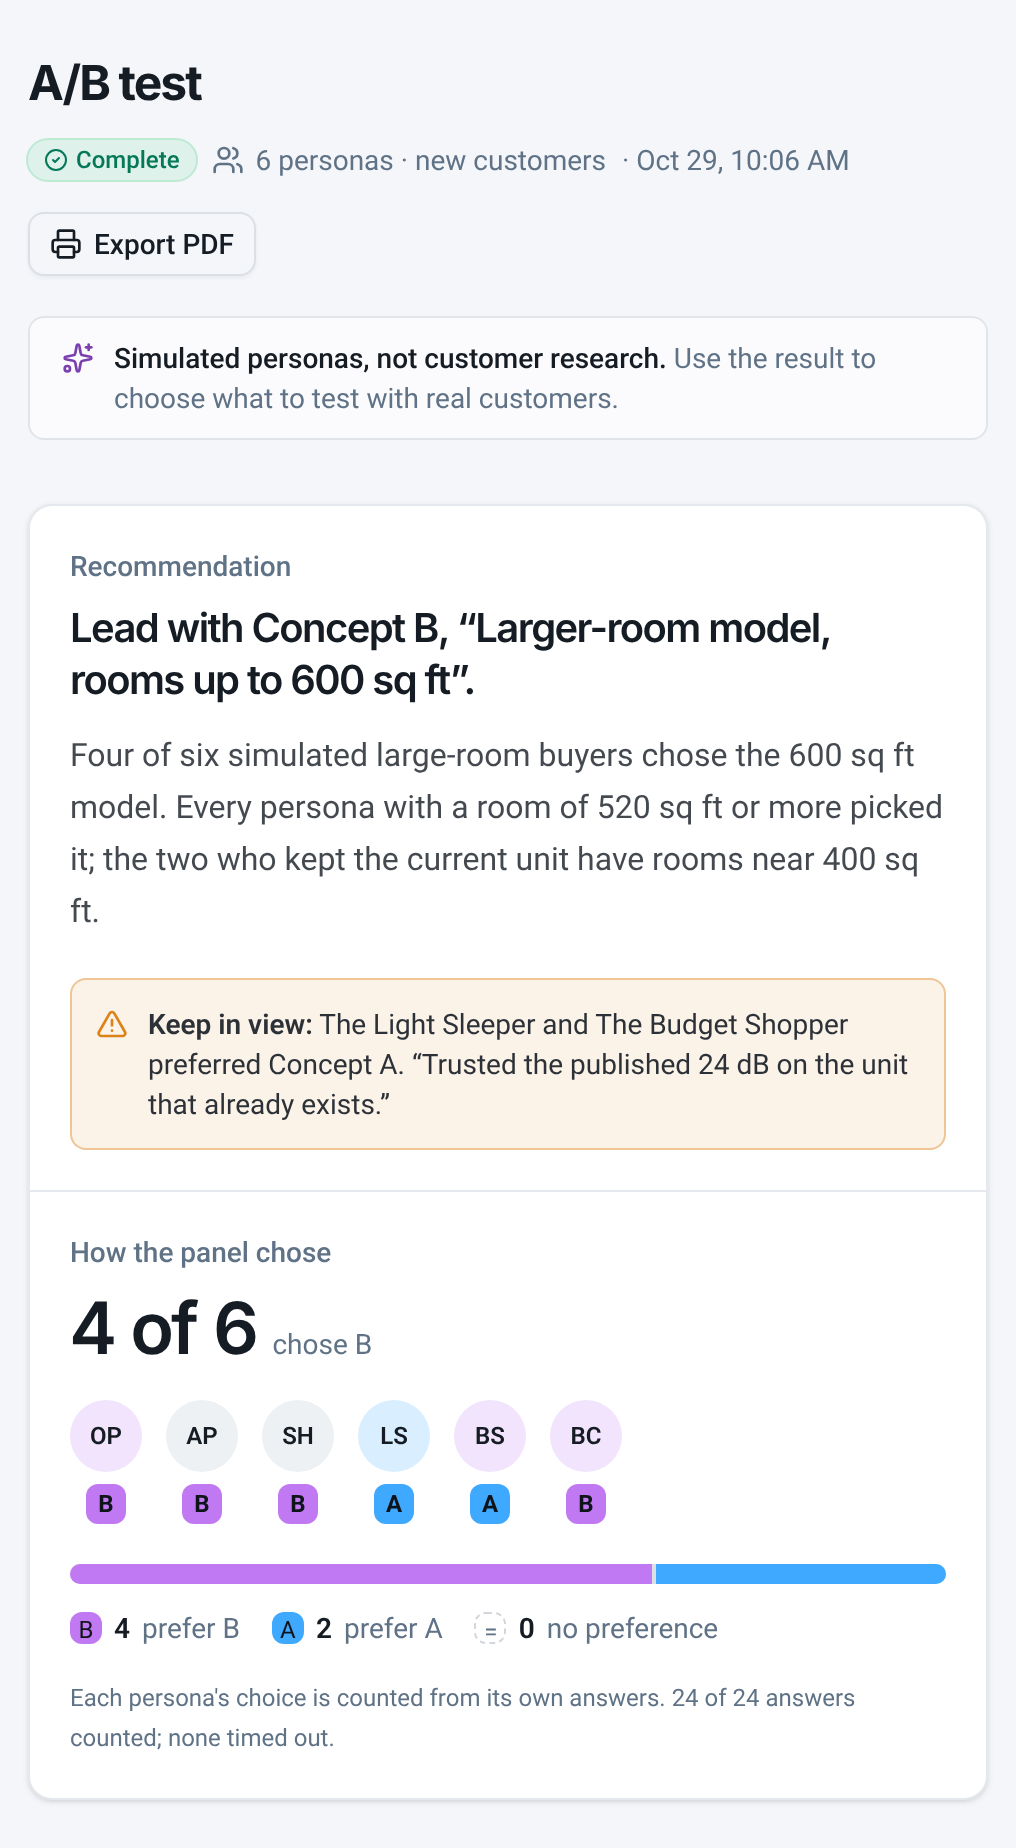
4 of 6 simulated large-room buyers chose the 600 sq ft model at $249.99 over today's unit at $189.99.
Four chose the larger model. Two with rooms near 400 sq ft did not.
An A/B test of today's unit against the drafted model, run on six simulated buyers with rooms of 420 to 600 sq ft. The light sleeper wants a tested noise figure before believing a bigger fan holds 24 dB, and the budget shopper will not pay $60 more for a 420 sq ft room. The report keeps both in view.
Simulated buyers are not customer research. Further down, the report shows each buyer's reading of both models and the answer behind it.
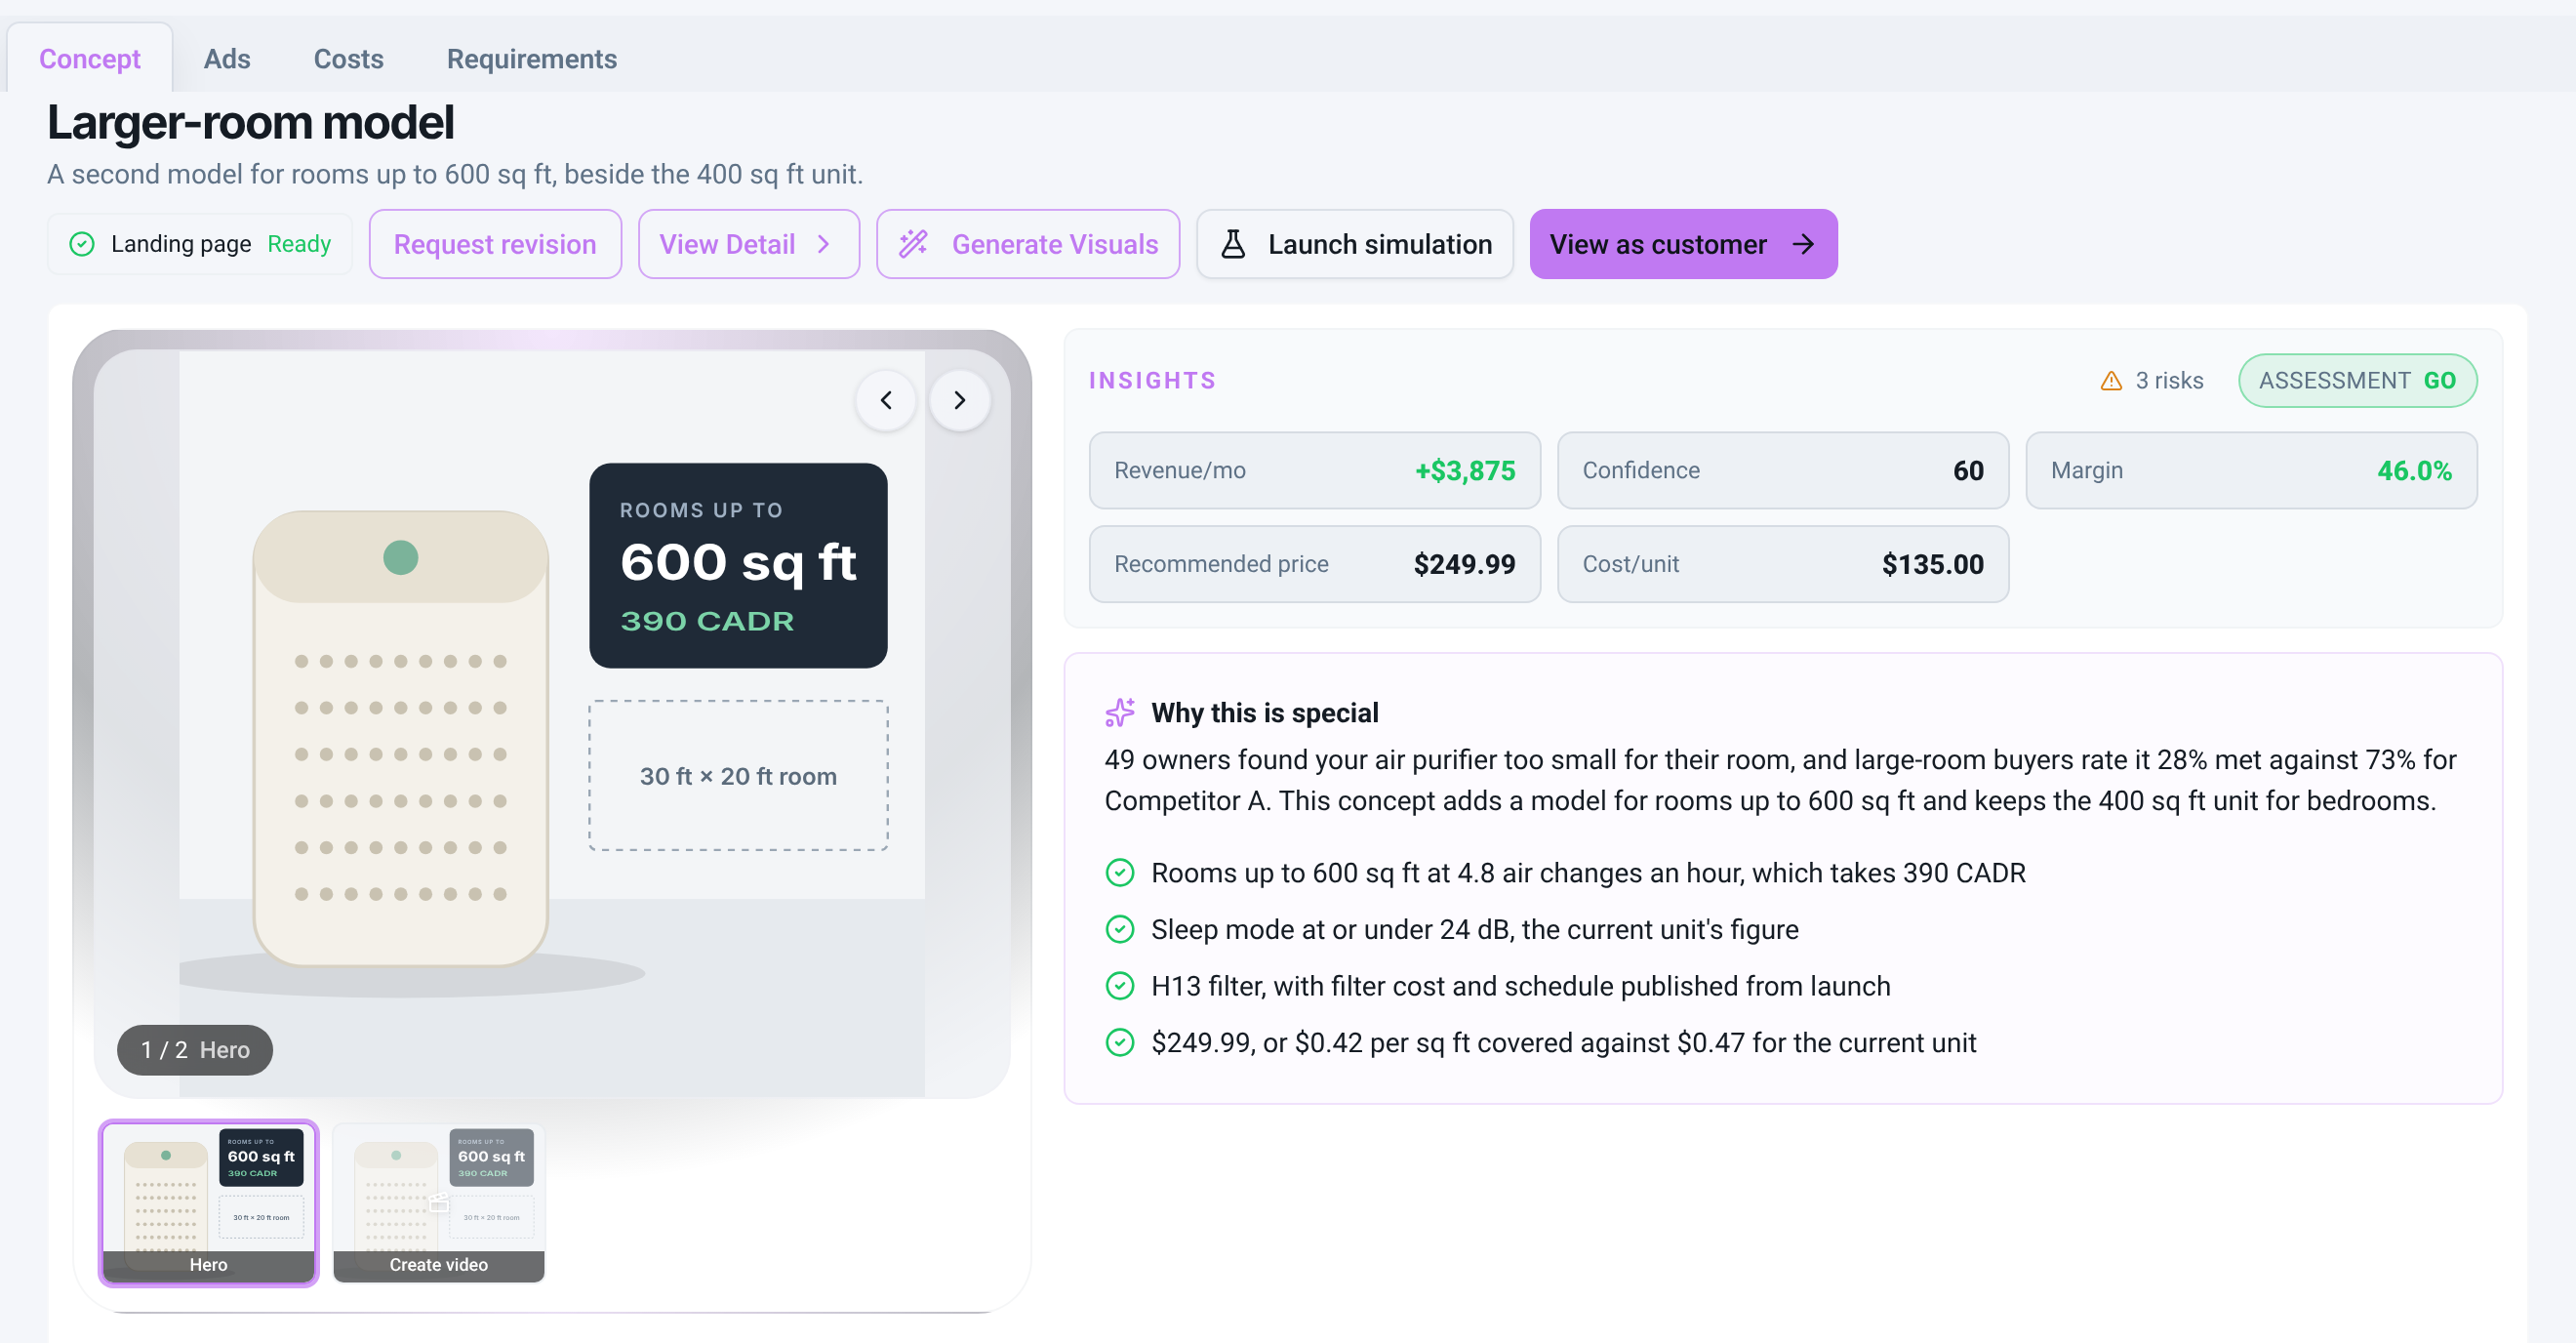
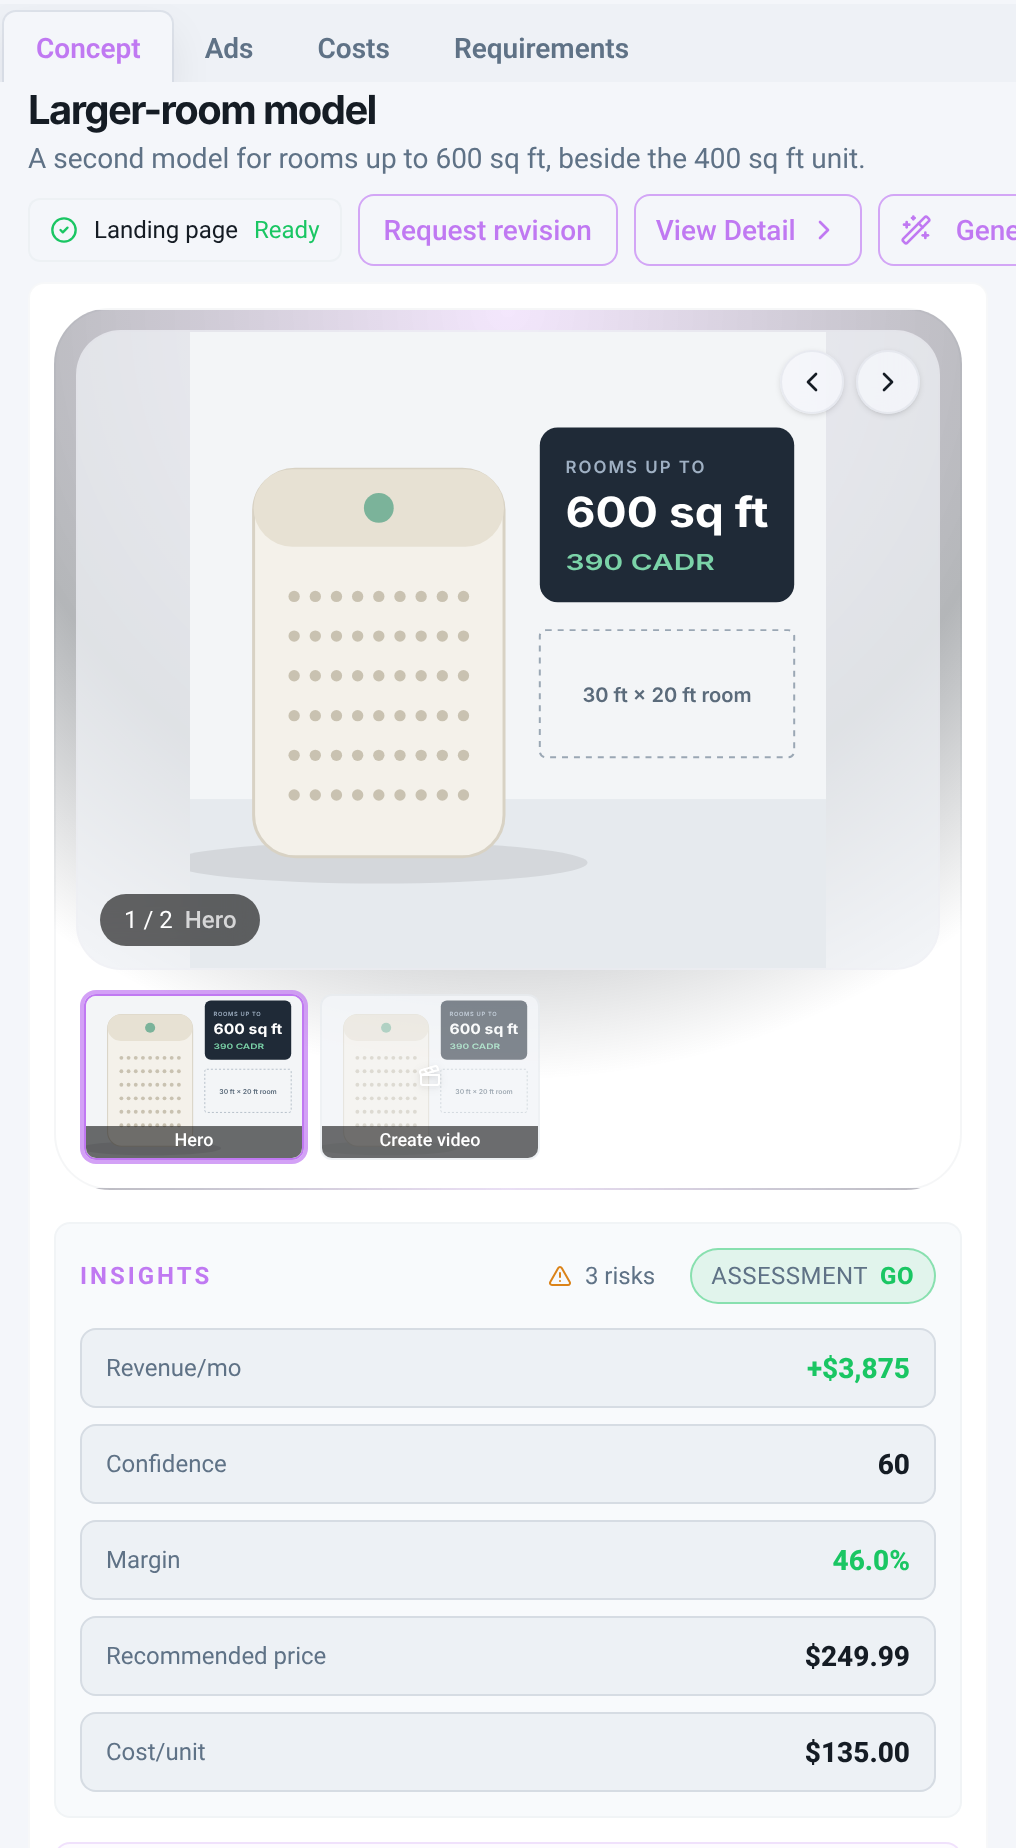
The draft: rooms up to 600 sq ft, 390 CADR, $249.99, and a 46.0% margin on a $135 unit cost.
The next product, drafted as a concept
Concept Studio turns row 2 into a product brief. Room size and CADR keep the current unit's ratio, 4.8 air changes an hour. The price is $0.42 per sq ft covered, the same as Competitor B and under your $0.47. Revenue is row 2's $3,875 a month and confidence is its 60. Margin is the price less a $135 unit cost, an example input the brand supplies.
The product picture is a placeholder drawing. In the product, that slot holds generated imagery.
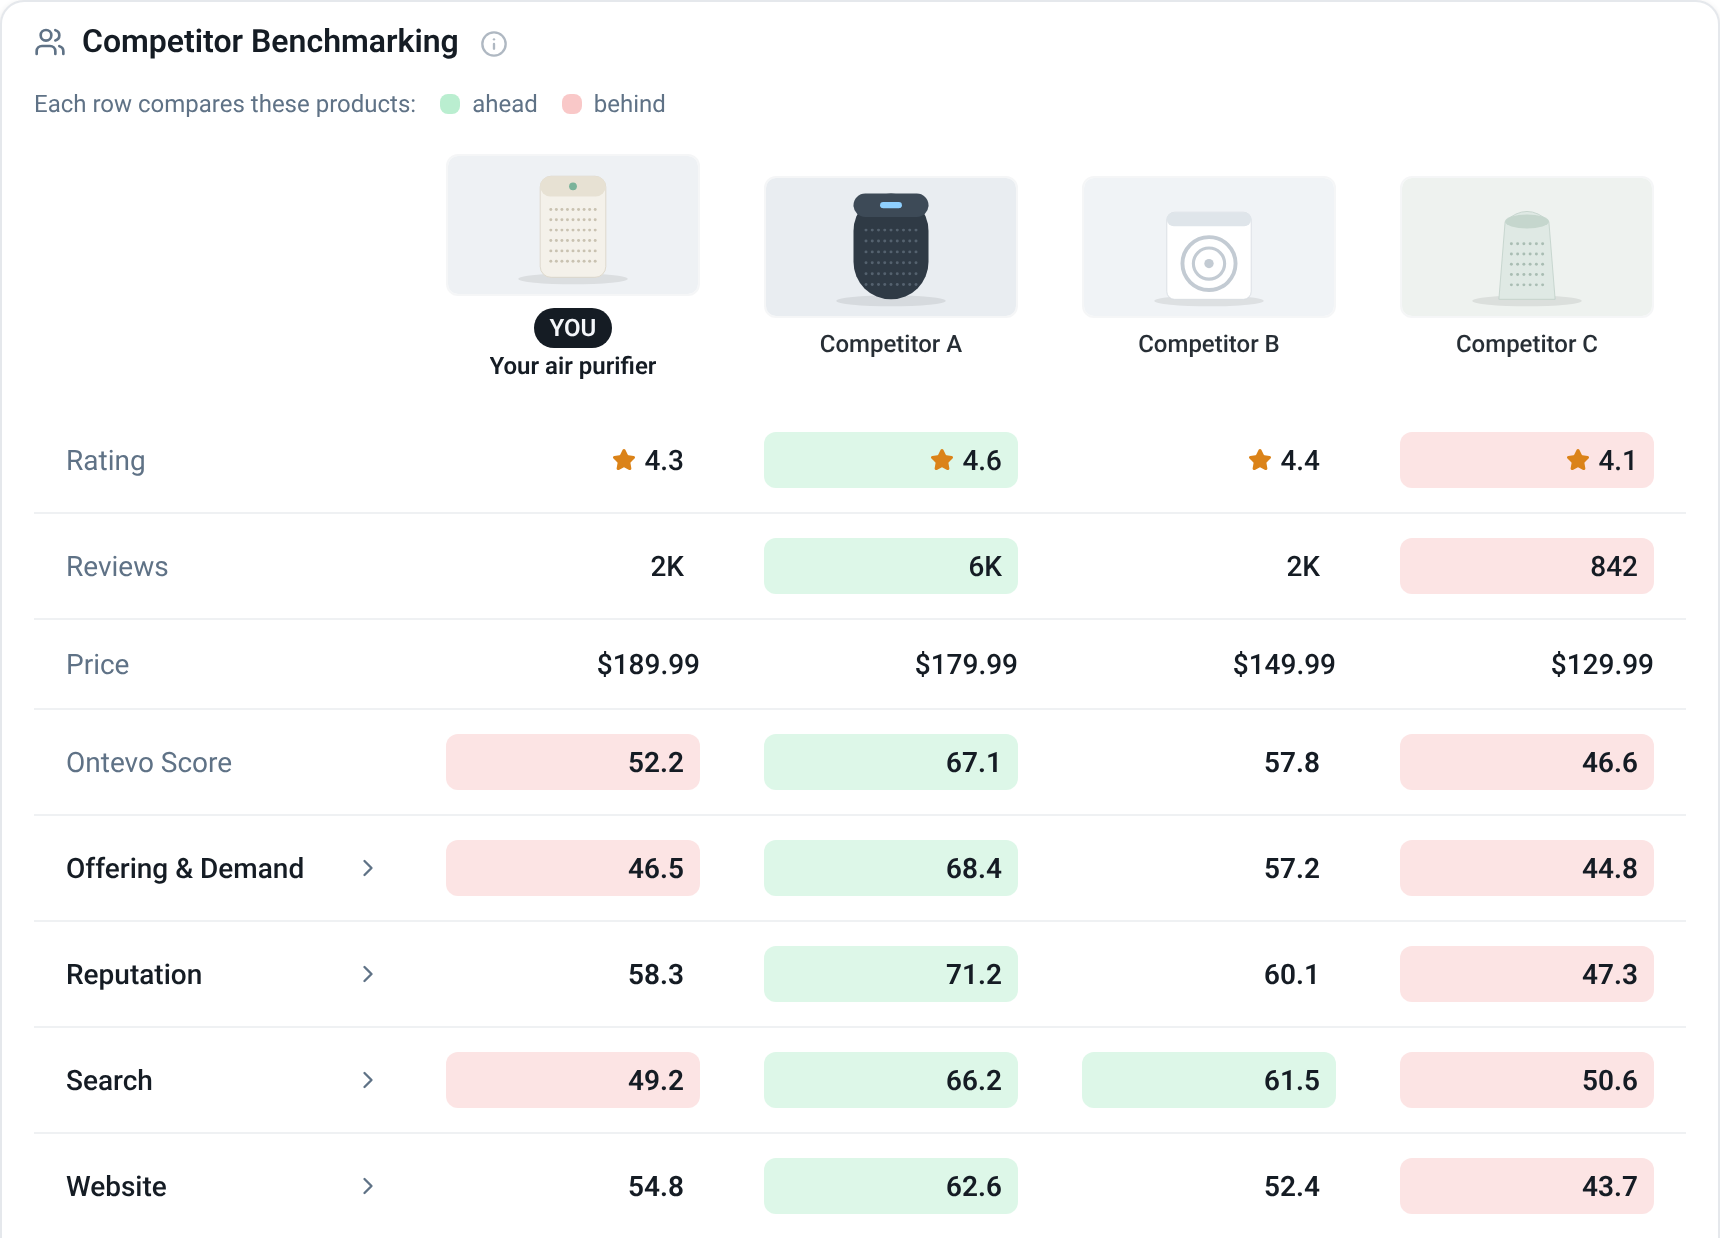
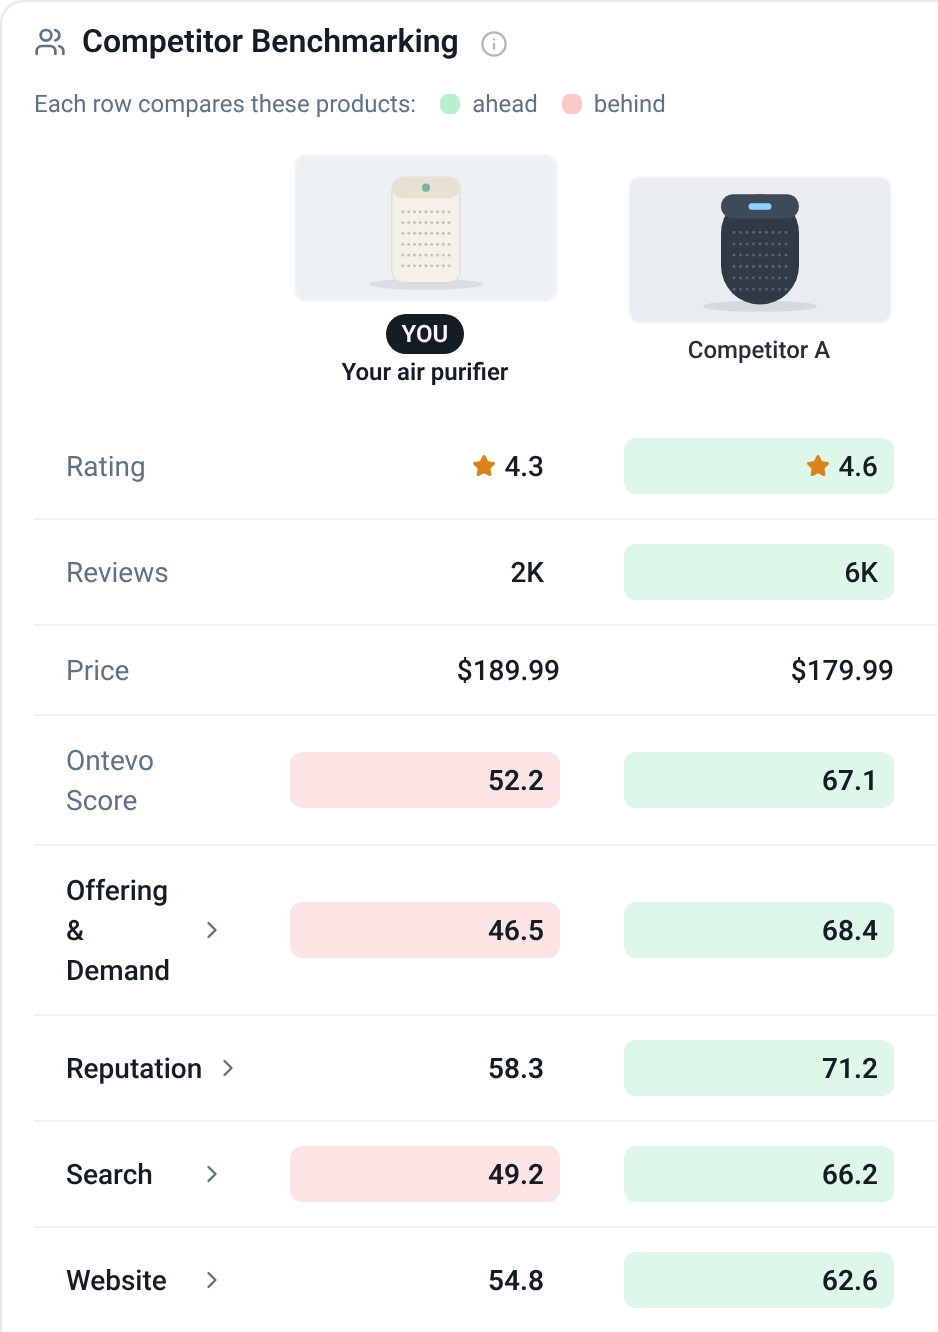
Shown here: your air purifier and Competitor A. In the product, the other two columns scroll into view.
It costs the most of the four and scores third.
Ontevo Score
A score from 0 to 100: the average of the four pillar rows under it. AI Visibility has its own card above and is not in this score. Yours is 52.2, against 67.1 for Competitor A.
Green leads, red trails
Each row is shaded against the group. Unshaded is near the middle. Price is never shaded.
Where a report like this gets used.
Product, R&D and insights teams
Range and line reviews
Bring the gaps to your next range review with a source on every number.
Marketing teams and agencies
Quarterly priorities and pitches
Rank a brand's fixes by modeled revenue. Agencies can run the same Full Diagnostic on a client or a prospect.
Consultancies
Outside-in baseline
Start client work knowing where the product wins and loses with buyers, built from public listings, reviews and search results, before the first interview.