Industry Benchmarking: What AI Reveals About Your Competition (That Dashboards Can't)
Your Dashboard Shows the Score. It Doesn't Show Why You're Losing.
Specialty dental practices spend an average of $1,500/month on marketing they can't attribute to a single new patient. Across 40,214 specialty dental practices in the US, that's $723 million per year in unattributed marketing spend: money flowing out with no feedback loop telling anyone whether it worked.
And that's just the practices that are trying. Only 40% of specialty dental practices use any form of intelligence tool at all. The other 60% (roughly 24,128 practices) have zero competitive visibility. They're setting fees, writing ad copy, and building treatment menus based on what worked three years ago.
This is a benchmarking problem, not a dental problem, and it spans every vertical.
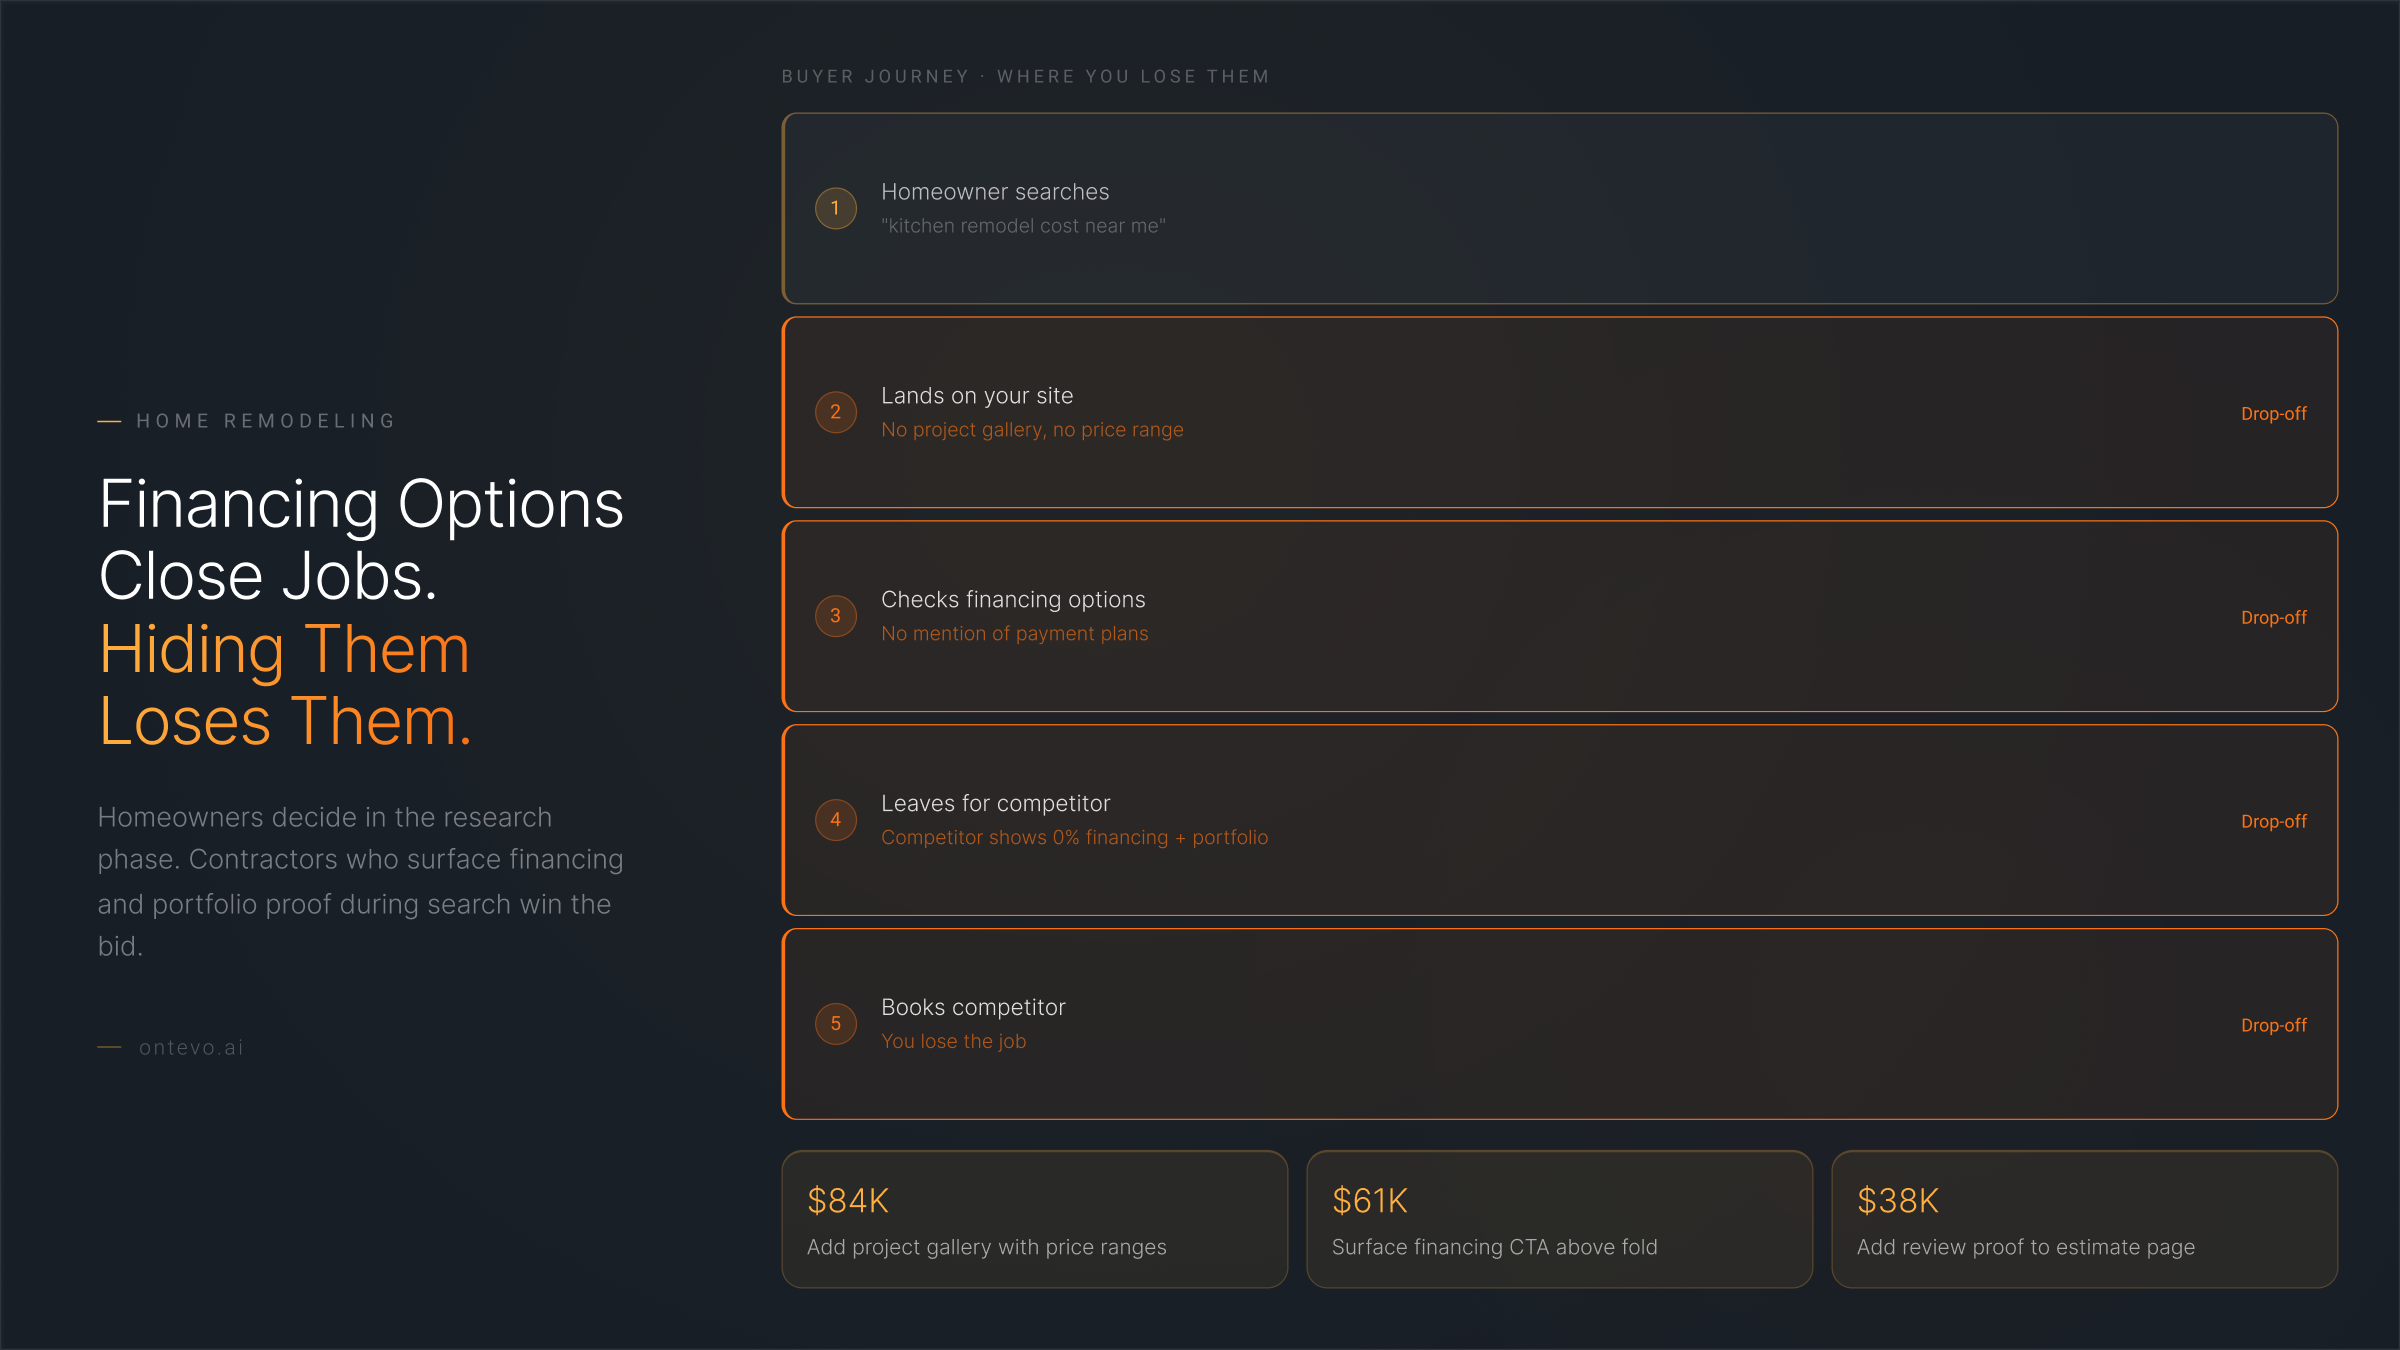
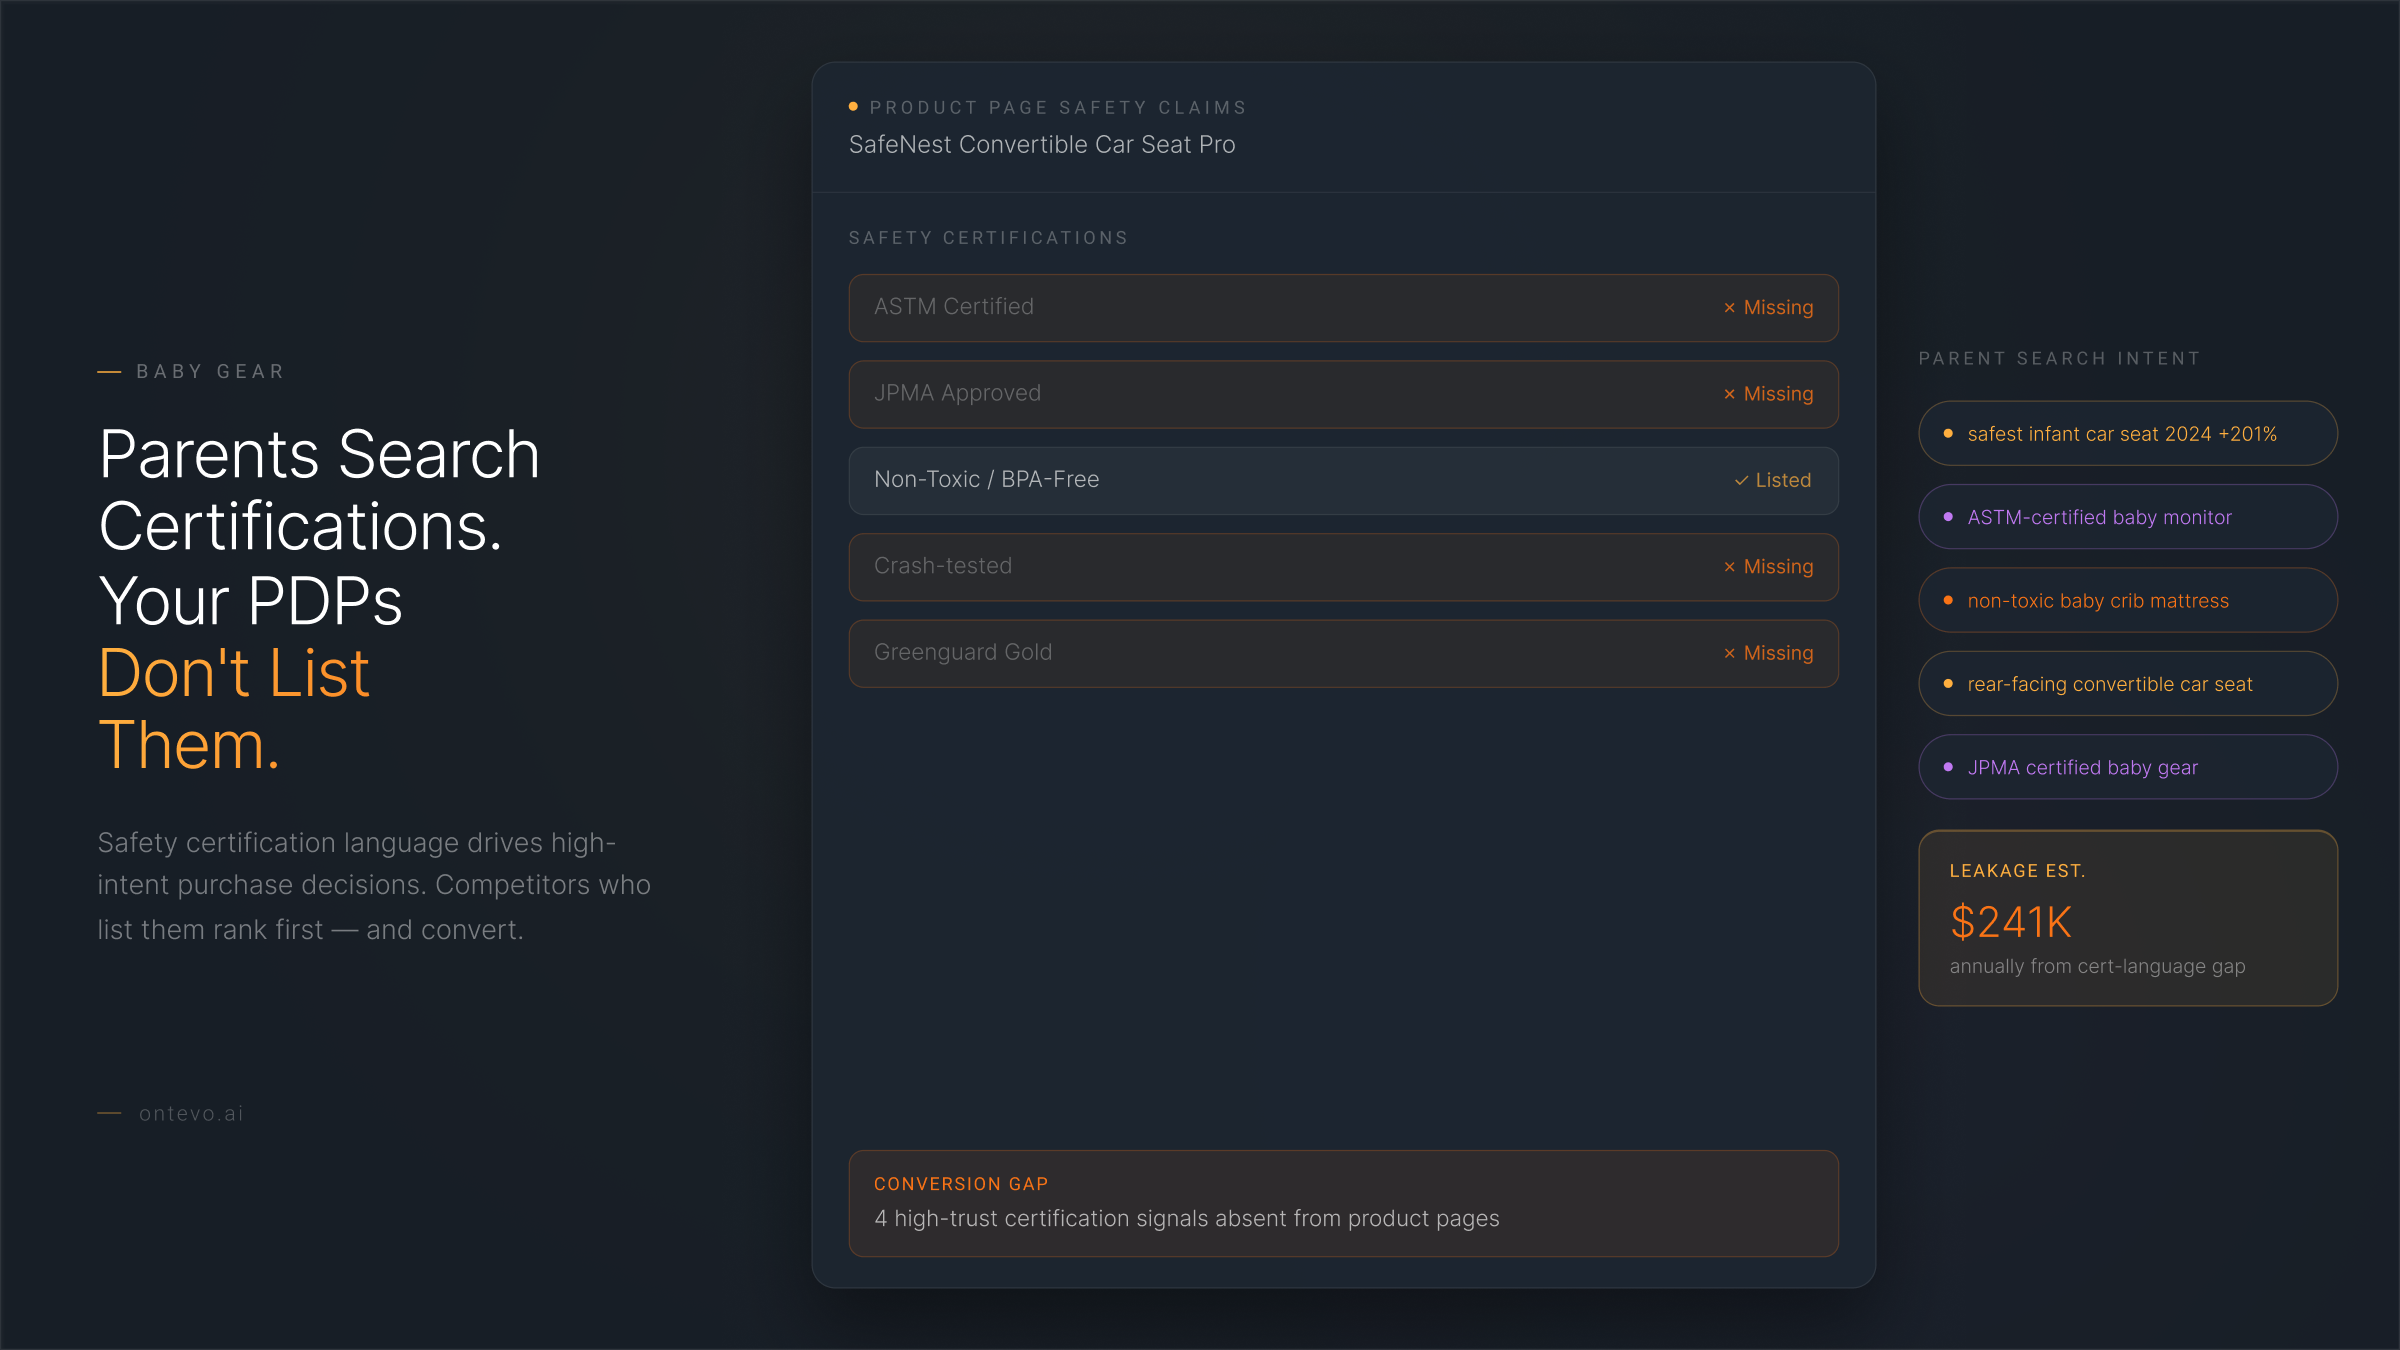
MedSpas benchmark against last quarter's revenue instead of this quarter's search demand. Cookware brands benchmark against their own star rating instead of the specific claims their competitors make on every listing. Remodelers benchmark against close rate without asking why 70% of their negative reviews mention dust and communication, not craftsmanship.
The common thread: traditional benchmarking measures lagging indicators. It tells you the score after the game is over. It never tells you what the market is demanding right now, what your competitors are doing about it, or what the gap is costing you in dollars per month.
What Traditional Benchmarking Measures (And Why It's Not Enough)
If you run a dental practice, your current benchmarking probably looks like this: new patient starts per month, case acceptance rate, production per visit, referral source mix. These are useful numbers. They're also lagging indicators: they tell you what already happened, not what's about to happen.
The tools most practices use reinforce this backward-looking posture. Dental Intelligence (Modento) integrates with your PMS and gives you clean dashboards, but it has zero marketing attribution and no local SEO insight. Birdeye (~10% market share among specialty dental) and Podium (~12%) manage reviews and reputation, but neither can decompose review themes against a competitive cohort or connect reputation signals to revenue.
Here's the gap no tool in the typical stack fills:
- Demand signals: what patients actually search for in your metro
- Visibility gaps: what your GBP and website surface vs. what the market wants
- Reputation themes: what reviews reveal about the experience, decomposed by theme
- Dollar impact: the estimated revenue lost per gap, per month
Your dashboard might tell you case acceptance dropped to 58% this quarter. It can't tell you that 68% of local searches include the word "sedation" and your profile doesn't mention it once. That's strategic blindness, not a reporting problem.
The 4-Pillar Benchmark: A Framework for Forward-Looking Intelligence
Real benchmarking connects four layers of intelligence into a single diagnostic. Miss any one pillar and you're making decisions with incomplete data.
Pillar 1 (Offering & Demand): Is Your Offer Aligned with Actual Demand?
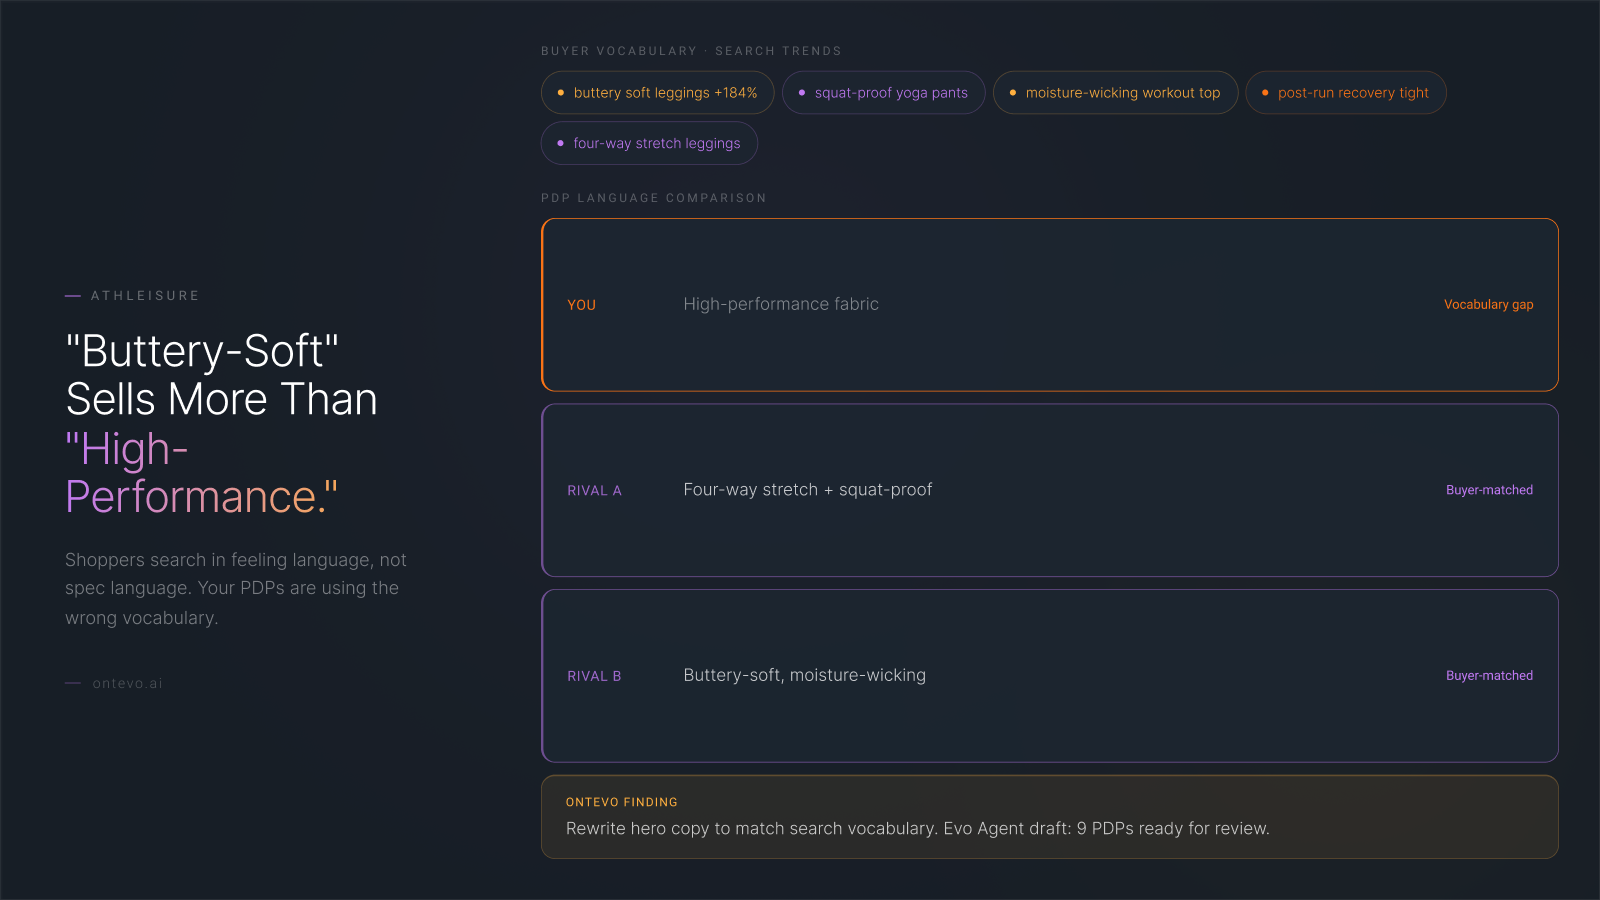
The question is more specific than "do people want what you sell": does the language of your offer match the language of the market? In dental, 68% of local searches include modifiers like "sedation," "same day," "financing," or "painless." In MedSpa, Traptox has 340% more search demand than generic "Botox." In cookware, 4 of 5 competitors claim "Metal Utensil Safe." If your profile, menu, or listing doesn't surface these terms, you're invisible to the highest-intent buyers.
Pillar 2 (Competitive Position): How Do Your Claims Compare to the Cohort?
This is spec-level benchmarking: not "how many reviews do I have vs. competitors" but "what specific services, features, and claims do my competitors surface that I don't?" When 60% of competing oral surgeons list IV sedation and same-day implants while your GBP says only "dental implants," the benchmark reveals exactly why your phone isn't ringing for self-referred cases.
Pillar 3 (Reputation Signal): What Are Reviews Actually Saying?
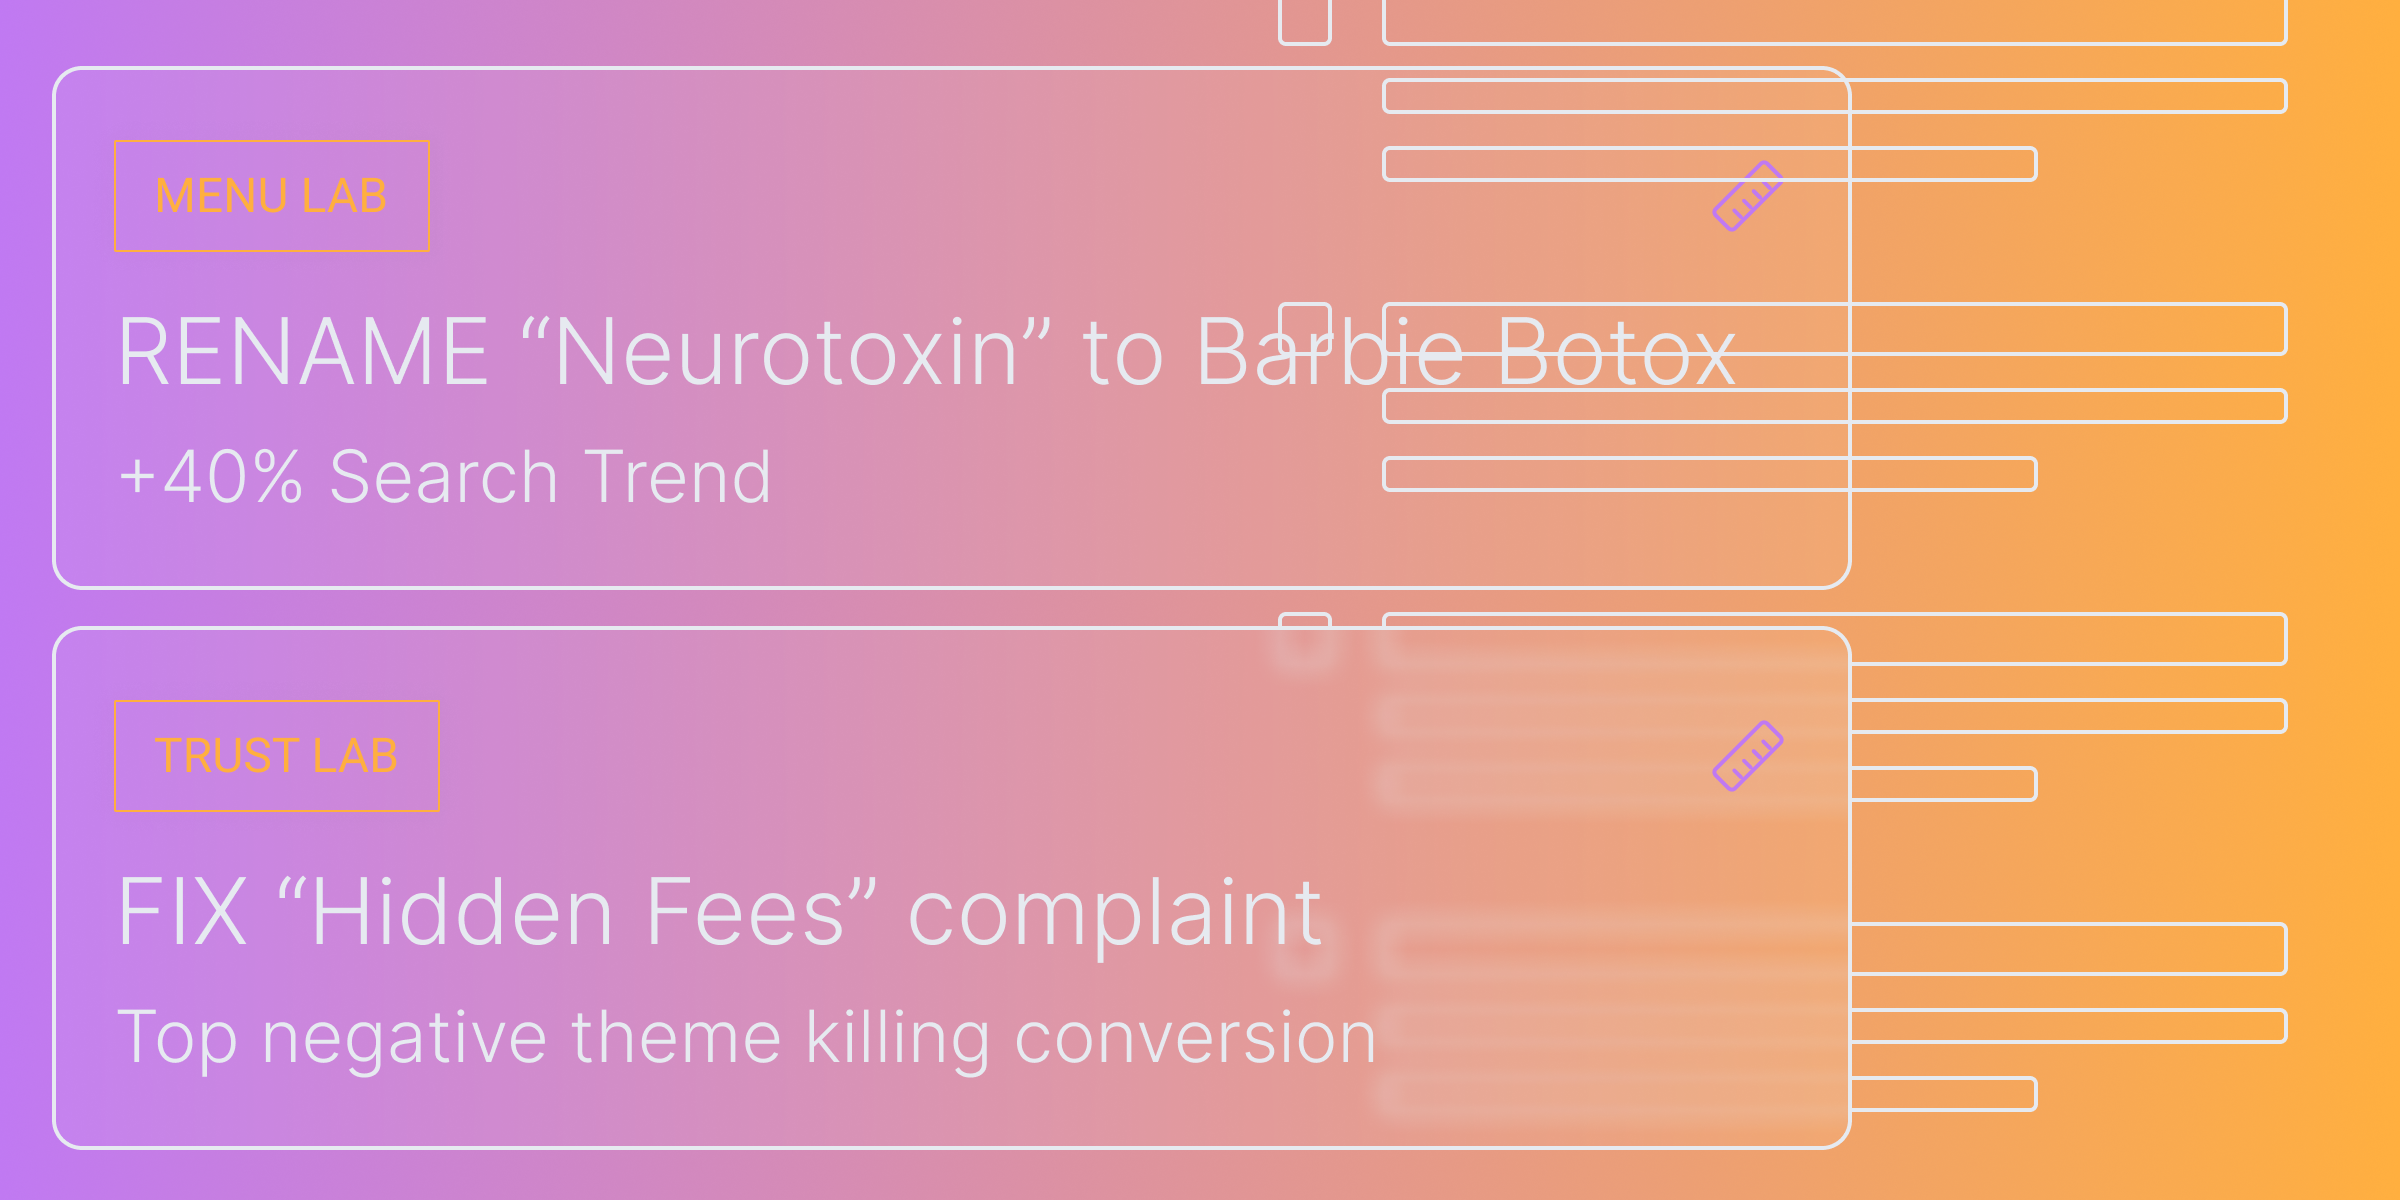
Star ratings are vanity metrics. Theme decomposition is intelligence. The top 5 negative review themes in specialty dental tell a story no dashboard captures:
- Long wait times / feeling rushed
- Sticker shock / no financing discussed
- Rude front desk / unreachable by phone
- Pain management concerns / anxiety not addressed
- Poor post-op communication
A practice with 4.5 stars can still be bleeding cases if "sticker shock" appears in 30% of reviews. The benchmark is the theme, not the star.
Pillar 4 (Conversion Path): Can Someone Who Finds You Actually Book?
Visibility without conversion is expensive awareness. This pillar audits the friction between discovery and action: Can a patient book online at 10pm? Does the landing page answer the question the search query asked? Is the phone number clickable on mobile? Every friction point has a dollar value.
A practice can have great reviews (Pillar 3) but be invisible for the terms patients actually search (Pillar 1). A cookware brand can have the best product (Pillar 1) but lose on the listing (Pillar 2). A remodeler can win on price (Pillar 2) but lose on trust signals (Pillar 3). All four pillars must be measured together. That's the difference between a dashboard and a diagnosis.
Specialty Dental: The Invisible Demand Gap
A specialty dental practice (oral surgery, periodontics, implants) has a median annual revenue of roughly $1.27 million (ADA Health Policy Institute, 2021). That's about $105,679 per month in gross revenue.
Now run the 4-pillar benchmark:
Pillar 1 (Offering & Demand): 68% of local dental searches include comfort or financing modifiers. The practice's GBP mentions zero comfort-related attributes.
Pillar 2 (Competitive Position): 60% of competing oral surgeons in the metro list "IV sedation" and "same-day implants." This practice lists only "dental implants."
Pillar 3 (Reputation Signal): Negative reviews cluster around anxiety, sticker shock, and post-op communication: exactly the themes the GBP fails to address proactively.
Pillar 4 (Conversion Path): 62% of implant consults ghost, and it's not because of price. Fear is cited 3x more often than clinical outcomes. The booking flow does nothing to address it.
The revenue math:
$4,500 average case value × 5 lost self-referred cases/month = $22,500/month. Add $1,500/month in unattributed marketing spend. Total: ~$24,000/month (roughly 23% of gross monthly revenue) evaporating because the offer doesn't match the demand.
This is a benchmarking problem, not a marketing problem. The practice was measuring case acceptance rate and new patient starts, both lagging indicators. The 4-pillar benchmark reveals the cause: the market demands sedation, financing, and comfort language. The practice surfaces none of it. Competitors surface all of it.
If your GBP needs work, start with the complete GBP audit checklist for service businesses.
MedSpa: The Menu-to-Demand Mismatch
In MedSpa, the benchmarking failure looks different but follows the same pattern.
Traptox (the application of neurotoxin to the trapezius muscle) has 340% more search demand than generic "Botox." But most MedSpa menus still list "Botox" as a single line item without mentioning application-specific treatments. The practice is benchmarking against its own past revenue instead of against current market demand.
The CapEx trap makes this worse. CoolSculpting demand is down 20% year-over-year. Morpheus8 is up 45%. A $150K equipment purchase based on last year's benchmarks is a six-figure mistake. Forward-looking benchmarking would have flagged the trend velocity before the purchase order was signed.
The benchmark that matters: map your menu against the top 20 searched treatments in your metro, ranked by demand velocity. The gap between what you offer and what the market wants is your revenue leak, quantified. For MedSpas, that gap runs roughly $10,400/month in missed revenue.
For the full breakdown, read how menu stagnation costs MedSpas $10K+/mo.
Cookware: The Spec War
In product verticals, benchmarking means comparing your listing claims against every competitor's listing claims, spec by spec, feature by feature.
When 4 of 5 competitors claim "Metal Utensil Safe" and you don't, you lose the comparison shopper regardless of actual product quality. The buyer has five tabs open. They're scanning for checkboxes. Your product might be the best pan on Amazon, but if the listing doesn't explicitly claim the feature, it doesn't exist.
Review intelligence deepens the benchmark. "Warped" appears in 22% of competitor 1-star reviews. If your product doesn't warp but your listing doesn't explicitly claim warp resistance, you're failing to exploit the competitor's most visible weakness.
The benchmark that matters: a feature-by-feature matrix of every claim made by the top 5 competitors, cross-referenced against the top complaint themes in their reviews. Your product roadmap and your listing copy should both be driven by this matrix. Without it, you're leaving an estimated $8,500/month in lost sales on the table.
For the full product-vertical breakdown, see why your product wins on quality but loses on the listing.
How to Build a Competitive Benchmark That Actually Drives Decisions
Here's a process you can start today with free tools. It's labor-intensive (which is exactly why AI-automated versions exist), but the methodology is sound regardless of how you execute it.
Step 1: Map Demand
Use Google Keyword Planner, Google Trends, or even Google's autocomplete suggestions to identify the top 15–20 terms your market actually searches for. Start with what they want, not with what you offer.
- For a dental practice: search "dental implants [your city]" and note every modifier Google suggests: sedation, same day, affordable, painless, financing
- For a product brand: search your category and note every feature/benefit term: metal utensil safe, oven safe to 500°, dishwasher safe, non-toxic coating
- For a service business: search your service and note every trust/process term: dust-free, licensed, same-day estimate, warranty
Step 2: Audit the Cohort
For each of your top 5 local or category competitors, document:
- What services or features they explicitly claim (on GBP, listing, website)
- What their top 5 negative review themes are (read the 1- and 2-star reviews, all of them)
- What their booking or purchase flow looks like (can you book at 10pm? Is the checkout frictionless?)
This creates your competitive matrix.
Step 3: Score Yourself Against the Matrix
For every demand term and every competitor claim, mark whether your own profile, listing, or menu addresses it. Every unchecked box is a potential revenue leak.
Step 4: Quantify
Multiply the estimated monthly searches for each gap term by your average conversion rate and average case or order value. This gives you a dollar figure per gap per month.
Example: "sedation dentistry [city]" gets 320 searches/month. Your conversion rate on organic leads is 8%. Average case value is $4,500. If you're invisible for this term, the gap costs: 320 × 0.08 × $4,500 = $115,200/year, from a single missing term.
The math won't be perfect. It doesn't need to be. Even a rough quantification changes the conversation from "we should probably update our profile" to "this gap is costing us six figures."
The Attribution Problem: Benchmarking Without Revenue Connection Is Theater
The #1 complaint with current intelligence tools in specialty dental (and it echoes across every vertical) is the inability to attribute new patient revenue to specific campaigns or channels.
You can benchmark all day. But if you can't connect "we added sedation language to our GBP" to "7 new sedation-inquiry consults this month," the benchmark is academic. It's a report that sits in a folder. It doesn't change behavior.
What attribution-connected benchmarking looks like: every change you make based on a benchmark gap gets tagged. When a new patient arrives through that channel or mentions that term, the loop closes. Benchmarking becomes a continuous revenue feedback system, not a quarterly PDF.
The scale of this problem is staggering: 40,214 specialty dental practices × $1,500/month unattributed spend × 12 months = $723.9 million per year in marketing spend that no one can connect to a single new patient. Even a 20% improvement in attribution efficiency would redirect $144 million toward channels that actually produce cases.
The data already exists: in search consoles, in call tracking, in review text, in booking logs. The gap is that no tool in the typical stack connects those sources into a single attribution loop. The benchmark finds the gap. Attribution proves the fix worked. Without both, you're guessing.
What AI Changes About Benchmarking (And What It Doesn't)
AI makes the data collection layer dramatically faster. Scraping competitor listings, decomposing review themes, mapping search demand: tasks that used to take a consultant 40 hours can now run in minutes.
But AI without a structured ontology hallucinates. "Sedation dentistry" maps to three different clinical protocols. "Same-day implants" means different things to an oral surgeon vs. a prosthodontist. "Glass Skin" in skincare maps to a specific combination of Niacinamide and Hyaluronic Acid, not a vague aesthetic. The semantic bridge between consumer language and business-specific terminology is what makes AI benchmarking accurate vs. dangerously generic.
This is why generic ChatGPT prompts don't replace structured competitive intelligence. The AI needs to know that when a patient searches "painless implants," the clinical answer involves IV sedation protocols, not just the word "painless" on a website. Without that mapping layer, the benchmark is noise.
What AI doesn't change: you still need a human to decide what to do with the benchmark. The doctor still approves the new GBP language. The brand manager still decides whether to reformulate. The remodeler still decides whether to invest in containment protocols. AI compresses the intelligence cycle. It doesn't replace judgment.
The emerging model is AI agents that continuously monitor the competitive set and flag changes (a new competitor adds "same-day implants" to their GBP, a competitor's negative review volume spikes on "wait times") so you can respond in days, not quarters. For a deeper look at how this agent model works, read how AI agents continuously monitor and act on competitive intelligence.
From Benchmark to Action: Closing the Loop
Here's the full cycle:
- Demand Map: What does the market actually search for?
- Competitive Matrix: What do your competitors claim that you don't?
- Gap Score: Where are you invisible or under-positioned?
- Revenue Quantification: What is each gap costing you per month?
- Prioritized Action List: Which gaps have the highest ROI to close first?
- Attribution Loop: Did closing the gap actually produce revenue?
Most businesses stall at step 1 or 2. The ones that complete all six steps don't wonder whether their marketing is working: they know, with dollar figures attached.
Three things to walk away with:
- Your current benchmarking is incomplete. If it doesn't connect demand signals to competitive gaps to reputation themes to revenue impact, it's showing you the score without explaining the game.
- The process is doable today. Steps 1–4 work with free tools and a weekend of focused work. The manual version is tedious, but the methodology is sound.
- Every gap has a dollar value. That value is a specific, calculable monthly figure, not a vague "opportunity." That's what turns a benchmarking exercise into a business case.
The market moved. Your competitors adapted. The question is what the gaps are costing you right now, not whether they exist.
Ontevo Research. Where this post carries figures, they come from Ontevo's own scan corpus or are modeled from scan patterns across the category. No figure is measured from a named customer.