How to Analyze Competitor Reviews to Find Market Gaps (Step-by-Step)

Your Competitors' Worst Reviews Are Your Best Market Research
Every product category on Amazon, Google, and Sephora contains thousands of unstructured customer interviews: complaints, wishlists, deal-breakers, spec demands. They're sitting in plain text, verified-purchase-tagged, and completely free.
Almost nobody reads them strategically.
Most brands read their own reviews for sentiment ("are people happy?") and stop there. Almost none read competitor reviews for strategic intelligence: spec gaps, unmet demand, and emerging trust signals that reveal exactly where the market is moving before keyword tools catch up.
This post teaches a 5-step framework:
- Collect reviews systematically across your competitive set
- Categorize them into 4 actionable buckets
- Extract 3 distinct signal types
- Map signals to spec gaps on your own product page
- Quantify the revenue impact in dollars
We'll walk through three worked examples (cookware, baby gear, and DTC skincare) so you see the universal pattern, not just one application.
By the end, you'll have a repeatable methodology that turns competitor reviews into a product roadmap, a PDP optimization checklist, and a CFO-ready business case.
Why Traditional Competitive Intelligence Misses the Product Layer
Most competitive analysis focuses on distribution: ad spend, keyword rankings, pricing, BSR trends.
Tools like Jungle Scout and Helium 10 show you search volume and best-seller rank, but not why a competitor's listing converts better at the spec level. Triple Whale and Northbeam track ROAS decline but can't tell you it's because your product page is missing the three specs buyers actually compare.
This is the "polishing the funnel while the product leaks" problem.
60% of Kitchen & Cookware brands already use some intelligence tool, spending a median $1,200/month. That budget goes almost entirely to attribution and keyword tracking: distribution intelligence. Meanwhile, a hero SKU PDP missing 3 of the top 5 category-expected specs sees roughly a 22% conversion rate drop versus spec-complete competitors.
That's a product intelligence problem, not a distribution problem. No amount of ad optimization fixes it.
Reviews close this gap because they contain the customer's own language for what matters. Not "ceramic cookware" as a search term but "I returned this because it warped on high heat" as a product truth; not "best stroller 2026" as a keyword but "I can't fold this with one hand while holding my baby" as a deal-breaker.
You're looking at 50 dashboards tracking yesterday's metrics, zero systems anticipating tomorrow's spec shifts. The framework below fixes that.
Step 1: Collect Reviews Systematically
Define Your Competitive Set
For most categories, this means your top 10–15 direct competitors plus 3–5 adjacent or aspirational brands. In cookware, if you sell ceramic non-stick, your set includes Caraway, Our Place, GreenPan, Made In, plus legacy players like All-Clad and Le Creuset for the premium benchmark.
Pick the brands your customers compare you to, not just the brands you think about: check your own reviews for brand mentions, and look at Amazon's "Customers also viewed" section.
Choose Your Sources
- Amazon reviews: richest for product-level intelligence (volume + verified purchase + specific complaints). Best for cookware, baby gear, consumer electronics.
- Google reviews: best for service businesses (MedSpas, dental, remodeling) where the experience is the product.
- Sephora/Ulta reviews: essential for beauty and skincare, where ingredient-level feedback surfaces.
- Reddit and YouTube comments: critical for high-consideration categories where buyers do deep research before purchasing.
How Many Reviews?
Collect at minimum 500 reviews per competitor for statistical significance. Ideally 1,000+. For a 15-competitor cookware set, that's 7,500–15,000 reviews. Sounds like a lot. It's manageable with the right tooling.
Practical collection methods:
- Manual: Browser extensions like Instant Data Scraper or Export Comments
- Semi-automated: Review aggregation tool exports (Yotpo, Okendo) or scraping APIs
- At scale: A simple Python script with BeautifulSoup or an API like RapidAPI's Amazon review endpoints
Time-bound your collection. Reviews from the last 18–24 months are most relevant. Older reviews reflect previous product iterations and outdated consumer expectations.
Step 2: Categorize Reviews Into 4 Actionable Buckets
Raw reviews are noise. Categorized reviews are intelligence. Every review you collect should be tagged into one or more of these four buckets:
- Bucket 1 (Defect Reports): Specific product failures. "Coating chipped after 2 months." "Buckle pinches my baby's fingers." "Pump stopped dispensing after 3 weeks."
- Bucket 2 (Wishlist Signals): Features customers want but don't have. "Wish it was dishwasher safe." "Need to know the exact oven-safe temperature." "Would love a one-hand fold."
- Bucket 3 (Comparison Mentions): When reviewers explicitly compare to another brand. "Better than my old All-Clad because…" "Switched from Caraway and this is heavier but more durable."
- Bucket 4 (Trust Signals): Claims or proof points that drove the purchase decision. "Bought because of the PFAS-free certification." "The egg slide test video convinced me."
The Language Mapping Challenge
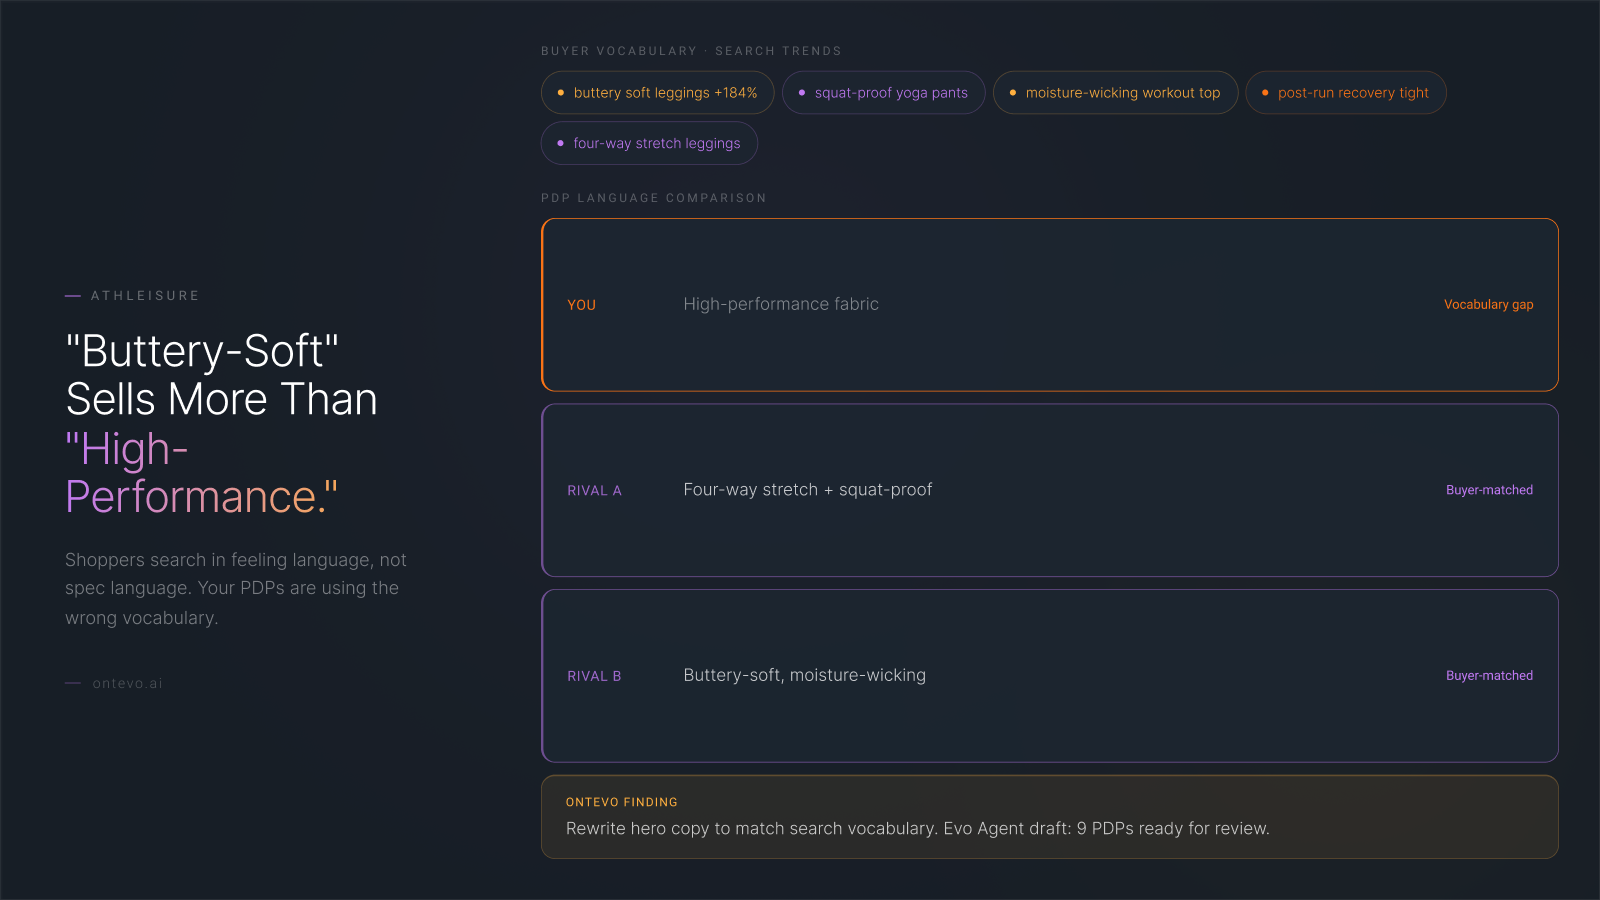
Customers don't use spec language. They say "it warped" not "insufficient thermal conductivity in the aluminum core." They say "the coating came off" not "PTFE adhesion failure."
Building a translation layer between consumer language and engineering specs (a semantic bridge) is critical:
- "Won't warp" → 5-ply bonded construction
- "Non-toxic" → PFAS-free, third-party certified
- "Glass skin" → Niacinamide + Hyaluronic Acid serum
- "Dust-free remodel" → Containment protocol
Without this bridge, you'll have a list of complaints. With it, you'll have a spec-level competitive map.
Frequency Scoring
Tag each review, then count. The output is a ranked list. Here's what real cookware negative review data looks like:
- Coating chipped/peeled: 22% of 1-star reviews
- Warped on high heat: 18%
- Non-stick degradation after 6 months: 15%
- Handle loosened: 11%
These are frequencies, not opinions. And frequencies are the foundation of every strategic decision that follows.
Step 3: Extract the Three Signal Types
Once your reviews are categorized, three distinct signal types emerge, each with a different strategic action and a different revenue impact.
Signal Type A: Bug Reports (Defect Patterns)
These are the most immediately actionable. When 22% of a competitor's ceramic pan reviews mention "coating chipped after 2 months," that's a product engineering signal with two possible actions:
- If your product doesn't have this problem: It's a messaging opportunity. Add "chip-resistant coating" to your PDP. Run comparison content. Turn their weakness into your selling point.
- If your product does have this problem: It's an R&D priority. You now know the exact failure mode customers care about most.
The top 5 negative themes in cookware: coating peeling (22%), warping (18%), non-stick degradation (15%), handle issues (11%), and misleading size/weight claims.
Signal Type B: Wishlist Signals (Unmet Demand)
This is the gold mine for product development and PDP optimization.
From the cookware data: 31% of cast iron alternative reviews contain "wish it was dishwasher safe" as a wishlist signal. That's a demand signal for the product they want to buy and can't find, not a complaint about the product they bought.
Cross-vertical examples of the same pattern:
- DTC Skincare: 40% unfulfilled Barrier Repair demand in the category: buyers are searching for it, brands aren't building it
- Baby Gear: "One-hand fold" is the #1 wishlist item in premium strollers: 5 of 6 synthetic buyer personas rejected a stroller based on fold mechanism difficulty
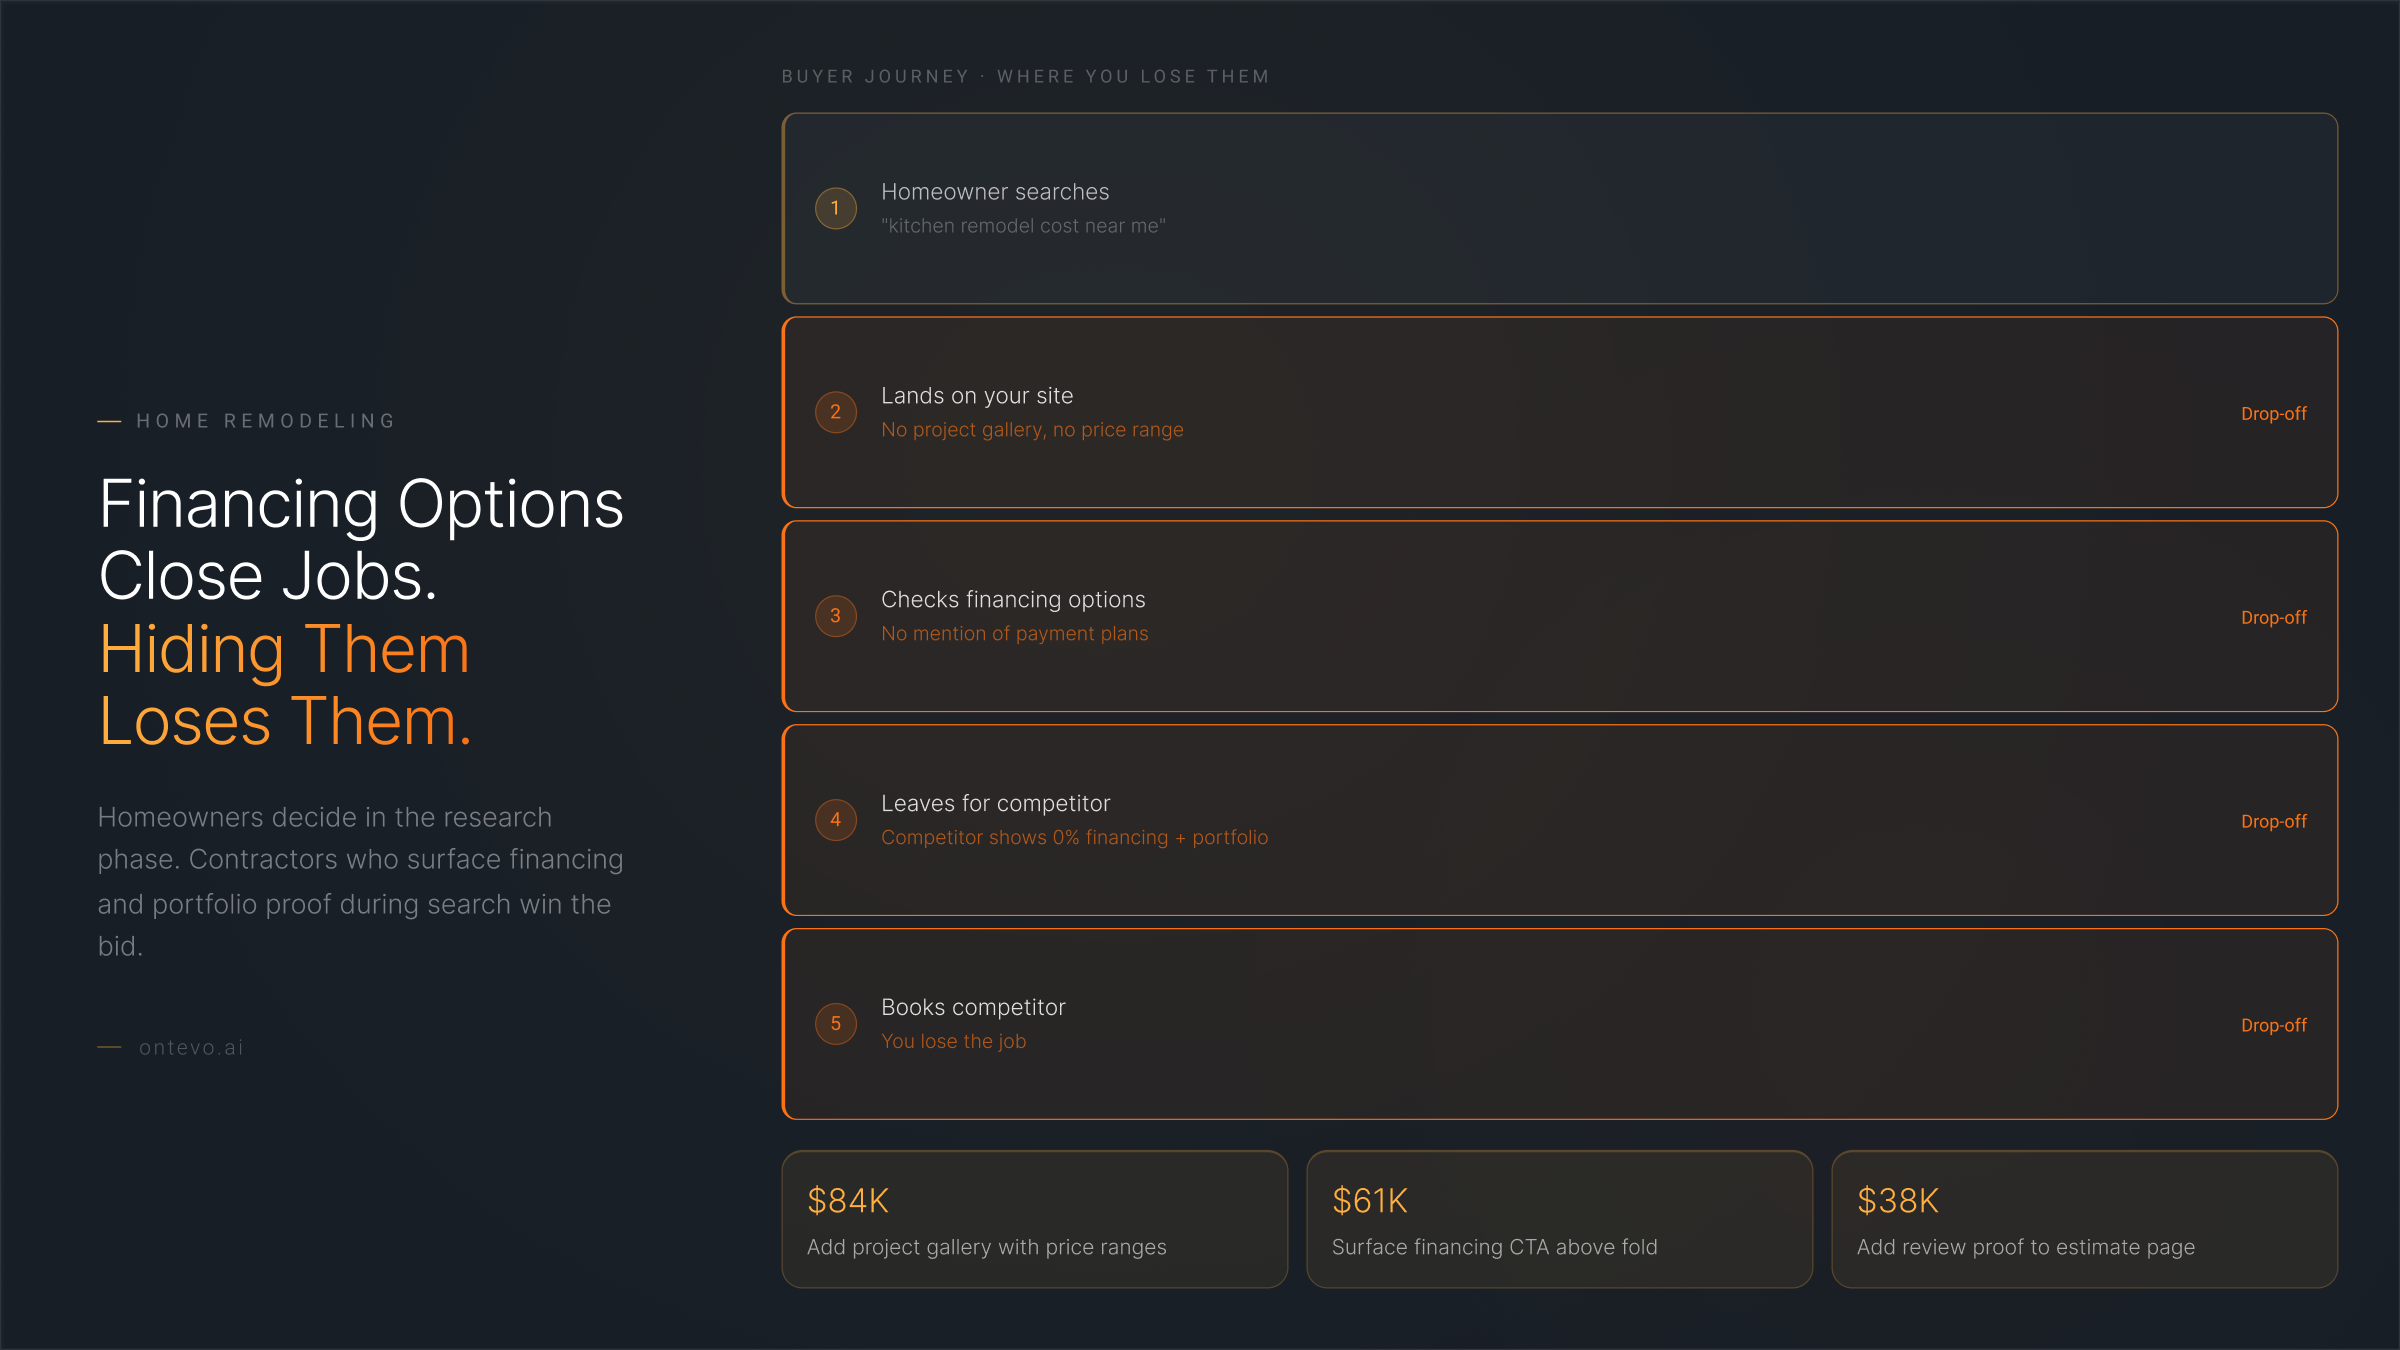
- MedSpa: Traptox has 340% more search demand than traditional Botox, but most menus don't mention it
Signal Type C: Emerging Trust Signals (Spec Migration)
This is the finding most competitive intelligence misses entirely.
Some specs move from "differentiator" to "table stakes" over time. Tracking where a spec sits on this lifecycle curve tells you whether adding it is defensive (must-have to avoid losing sales) or offensive (first-mover advantage).
The cookware data proves this concretely:
- PFAS-free has moved from differentiator to baseline: most top sellers now claim it. If you don't, you're losing on a table-stakes spec.
- Warp-free guarantee is the emerging trust signal: only 12% of cookware brands currently offer it. First-mover opportunity.
This lifecycle framework applies everywhere. In dental, "sedation options" moved from differentiator to expected. In skincare, "airless pump packaging" is migrating from premium signal to baseline. In remodeling, "dust containment protocol" is the emerging trust signal: it appears in 70% of negative reviews but almost no contractor's proposal.
Step 4: Map Signals to Spec Gaps on Your PDP
The PDP Audit
Take the signals from Step 3 and compare them against what your product page actually claims.
The fastest win in competitive intelligence is discovering your product already has a feature that your PDP fails to state; no new product required. In cookware, we've seen brands with 5-ply bonded construction (which prevents warping) that never mention "warp-free" on their listing. The product is better. The listing doesn't say so.
The Spec Benchmark Matrix
Build this grid. Rows = key specs. Columns = you + top 5 competitors. Fill in Yes / No / Claimed-but-unspecified.
Here's what the cookware version looks like:
- Metal Utensil Safe: 4 of 5 competitors claim it. Do you?
- Oven-Safe Temperature (specific): Most competitors list a number. Do you say "oven safe" without specifying the temp?
- Dishwasher Safe: 31% of buyers in adjacent categories are actively wishing for this.
- PFAS-Free (third-party certified): Table stakes. If you don't claim it, you're losing trust.
- Warp-Free Guarantee: Only 12% of brands offer it. Offensive opportunity.
Prioritization Framework
Not all spec gaps are equal. Rank by:
- Frequency in competitor reviews as a purchase driver: how often does this spec appear in positive reviews as a reason-to-buy?
- Table-stakes vs. differentiator: is this defensive (must-have) or offensive (first-mover)?
- Communication gap vs. product gap: do you already have the feature and just need to say it, or do you need to build it?
Quick wins (communication gaps) should be fixed this week. Medium wins (spec additions requiring testing or certification) go into the quarterly roadmap. Long wins (reformulation or redesign) go into the annual R&D plan.
Step 5: Quantify the Revenue Impact
This is where the intellectual exercise becomes a CFO-ready business case.
The Math
Missing specs → lower conversion rate → higher effective CAC → quantifiable monthly revenue leak.
Walk through it with real numbers for a $3.5M annual revenue cookware brand:
- Monthly paid acquisition spend: $85K
- Target ROAS: 3.5x
- Conversion rate drop from missing 3 of 5 category-expected specs: ~22%
- To generate the same revenue at a 22% lower conversion rate, the brand needs to spend: $108K/month
- Incremental wasted CAC: $108K – $85K = $23K/month
- Annual wasted CAC: $276K/year
The Inventory Risk Multiplier
Spec blindness costs you on product bets as well as conversion.
Missing the PFAS-free trend by one production cycle = 8,000 units at $15 landed cost = $120K in slow-moving inventory requiring 40% markdowns.
Total annual spec-blindness cost for a $3.5M cookware brand: ~$396K, or 11.3% of revenue.
Your Revenue Leak Calculator
Plug in your own numbers:
- Input 1: Monthly revenue
- Input 2: Monthly paid acquisition spend
- Input 3: Estimated conversion rate gap (use 15–25% as a range based on spec completeness)
- Input 4: Average landed cost per unit × units at risk from missed trends
- Output: Monthly revenue leak + inventory risk exposure
Even a rough estimate makes the business case. A 15% conversion gap on $50K/month in ad spend is $7,500/month in wasted acquisition cost. That's $90K/year, more than enough to justify a quarterly review intelligence cadence.
Worked Example #1 (Cookware): The Spec War
Full 5-step framework applied to a hypothetical ceramic cookware brand.
Competitive set: Caraway, Our Place, GreenPan, Made In, All-Clad. Review corpus: 50,000+ reviews across the set.
Key findings:
- 4 of 5 competitors claim Metal Utensil Safe on their hero SKU. Our brand doesn't, despite having a comparable coating.
- "Warped" appears in 22% of 1-star reviews across the category. Our brand's 5-ply bonded construction actually prevents this, but the PDP never mentions it.
- "Warp-free guarantee" is offered by only 12% of brands. First-mover opportunity.
Revenue impact: An estimated $8,500/month in lost sales from missing spec claims on the hero SKU PDP.
Action plan:
- This week: Update PDP with 3 missing spec claims (Metal Utensil Safe, specific oven-safe temp, warp-resistant construction)
- This quarter: Add warp-free guarantee as a category differentiator
- Next production run: Feed "dishwasher safe" demand signal into R&D
For the full breakdown of how spec gaps cost cookware brands $8,500/mo in lost sales, see the deep-dive analysis.
Worked Example #2 (Baby Gear): The Trust Tax
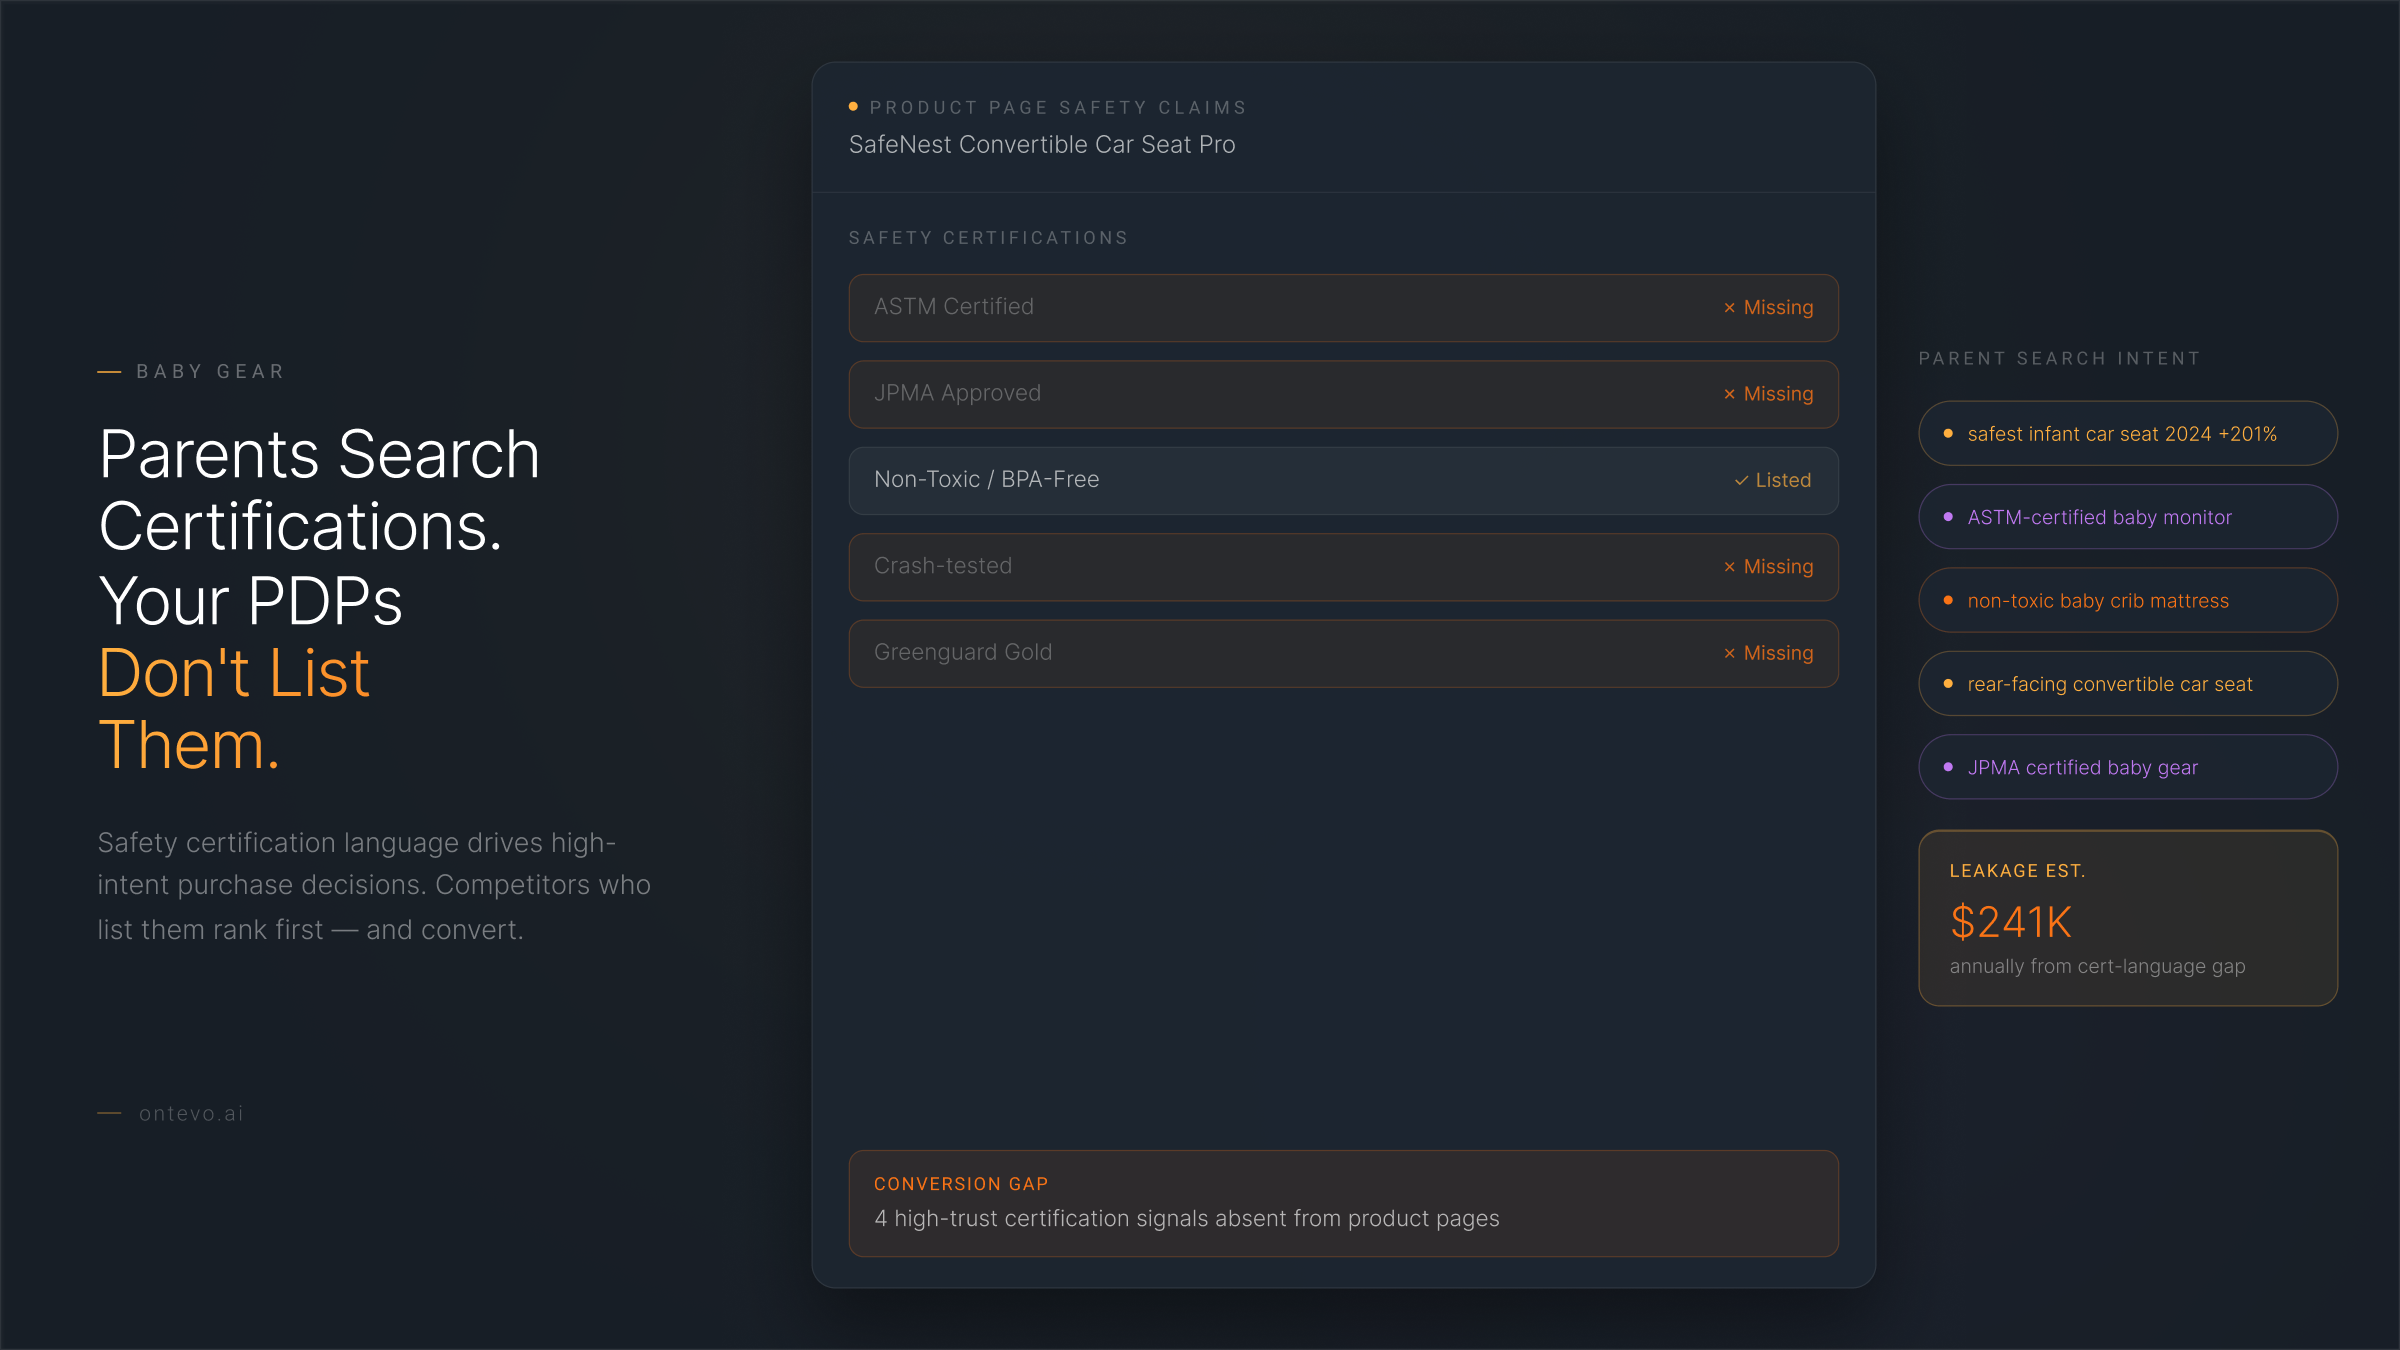
Parents read 50+ reviews before purchasing a stroller. A single UX bug creates permanently high CAC, not just one lost sale, because negative reviews compound trust erosion over time.
Key findings:
- "One-hand fold" is the #1 wishlist signal in premium strollers
- 5 of 6 synthetic buyer personas rejected a stroller based on fold mechanism difficulty alone
- Buckle pinch complaints appear consistently across the competitive set: a UX bug that no amount of ad spend can overcome
Revenue impact: $12,100/month in estimated cart abandonment from trust erosion.
The trust signal lifecycle is clear: "one-hand fold" is moving from differentiator to table-stakes in premium strollers. Brands without it are fighting an uphill conversion battle regardless of ad spend.
Read more: how a single UX bug creates permanently high CAC in baby gear.
Worked Example #3 (DTC Skincare): The CAC Tax
Counterintuitive finding: 42% of 1-star skincare reviews mention packaging, not formula.
The product might be excellent. But the delivery mechanism (jar vs. airless pump) is killing conversion and driving returns. Customers perceive jar-packaged actives as less effective (oxidation concerns), and they're right: airless pump packaging correlates with +40% perceived efficacy in clinical-adjacent categories.
Key findings:
- 40% unfulfilled Barrier Repair demand in the category: buyers are searching, brands aren't building
- $14,200/month in leakage from formula-packaging mismatch
- The wishlist-to-roadmap pipeline: review-mined demand for Barrier Repair + airless pump delivery = a product concept with pre-validated demand, reducing launch risk dramatically
The full breakdown: why 42% of 1-star skincare reviews mention packaging, not formula.
Common Mistakes (and How to Avoid Them)
Mistake 1: Only Reading Your Own Reviews
You already know your problems. Competitor reviews reveal market-level patterns and opportunities you can't see from inside your own data. The 22% coating-peeling frequency is a category-wide defect pattern, not a one-brand problem, and it creates a messaging opening for anyone who's solved it.
Mistake 2: Treating All Negative Reviews Equally
A complaint about shipping damage is an ops issue, not a product signal. Filter for product-specific feedback. Weight by frequency and recency. A defect mentioned in 22% of reviews is a strategic priority. A defect mentioned in 2% is noise.
Mistake 3: Stopping at the Finding Without Quantification
"Customers want dishwasher safe" is an observation. "$23K/month in excess CAC because your PDP is missing 3 expected specs" is a business case. Always attach a dollar figure. The framework in Step 5 exists specifically for this: use it.
Mistake 4: One-Time Analysis Instead of Continuous Monitoring
Consumer expectations shift. Specs migrate from differentiator to table-stakes. PFAS-free was a selling point two years ago; now it's baseline. The brands that win run this analysis quarterly, not annually. Set a calendar reminder.
From Manual to Systematic: Scaling Review Intelligence
The 5-step framework above works. You can execute it manually starting today.
But it doesn't scale easily. At 15 competitors × 1,000+ reviews × quarterly cadence, you're looking at 60,000+ reviews per year to process, categorize, translate into spec language, map against your PDP, and quantify financially.
This is the problem Ontevo was built to solve. The platform runs a 50-point diagnostic across 5 pillars, including the Spec Showdown, which builds the Spec Benchmark Matrix automatically, the Buyer Wishlist, which extracts unmet demand signals from review corpora, and the Complaint File, which surfaces defect patterns with frequency scoring. The same 5-step process described above, running continuously and autonomously across your entire competitive set.
Every finding comes with a confidence score, an evidence trail, and a revenue impact estimate. Not a dashboard but a financial validation artifact that speaks the language of the CFO.
The agents draft. You approve. Your strategy, your voice, systematized.
Run a free Rapid Scan on your competitive set, and we'll show you the 3 spec gaps costing you the most revenue.
Ontevo Research. Where this post carries figures, they come from Ontevo's own scan corpus or are modeled from scan patterns across the category. No figure is measured from a named customer.