The Innovation Blind Spot: 50 Dashboards for Yesterday, 0 Systems for Tomorrow

Your $6,125/mo SaaS Stack Has a Hole in It
Picture a Monday morning for a skincare founder running a $3.5M brand.
Fifty browser tabs. Shopify Plus ($2,300/mo). Klaviyo ($1,300/mo). Yotpo ($750/mo). Recharge ($1,775/mo). Maybe Triple Whale for attribution. Maybe Northbeam for media mix. Maybe Helium 10 for Amazon keyword rank.
That's $6,125/mo ($73,500/yr) in SaaS costs. Every single tool answers the same category of question: How efficiently are we moving this product to market?
Not one of them answers the question that actually determines survival: Is the product itself still competitive?
Right now, 40% of reviews in the $30–45 serum segment contain unfulfilled demand for barrier repair ingredients: Ceramides, Centella Asiatica. Only 18% of brands in that cohort include them. That's a massive market signal sitting in plain text on Amazon and Sephora, visible to anyone who looks.
Nobody's looking, because every tool in the stack is pointed backward.
This is the innovation blind spot: a category-level gap, not a dashboard problem, where businesses optimize the funnel while the thing inside the funnel quietly becomes obsolete.
Two Types of Intelligence, and You're Only Running One
Every business intelligence tool falls into one of two categories. Most operators only know the first one exists.
Distribution Intelligence
Tools that measure how efficiently you move an existing product or service to market. These are lagging indicators: they tell you what already converted or didn't.
- Triple Whale: Ad attribution and ROAS tracking
- Klaviyo: Email and SMS performance
- Northbeam: Media mix modeling
- Helium 10 / Jungle Scout: Amazon keyword rank and search volume
- Yotpo: Review collection and display
These tools answer: How well are we selling this?
Strategic Intelligence
Systems that evaluate whether the asset itself (the product, the menu, the service) is still aligned with what the market actually wants. These are leading indicators.
- Trend velocity (what's rising, what's declining, how fast)
- Spec gap detection (what competitors claim that you don't)
- Wishlist mining (what customers explicitly ask for in reviews)
- Price-value positioning (where you sit relative to the competitive cohort)
- Feature benchmarking (your actual specs vs. the market's expectations)
These answer a different question entirely: Should we still be selling this, in this form, at this price, with these specs?
Distribution intelligence is GPS navigation. Strategic intelligence is asking whether you're driving to the right city. Most businesses have a $73,500/yr GPS system. They have no map.
The Attribution Trap: Why the Blind Spot Persists
Founders default to distribution tools for understandable reasons. They produce clean numbers. They're tied to ad spend, usually the biggest discretionary line item. And they create the illusion of control.
Then ROAS drops from 3.5x to 2.1x. The instinct kicks in:
- Test new creative hooks
- Refresh UGC
- Try Advantage+ campaigns
- Shift budget to TikTok Shop
- Hire a new agency
All distribution moves. All assume the product is fine and the funnel is broken.
What nobody checks: Did a competitor just launch an airless-pump Ceramide serum at $28 that's stealing share? Did the market move from jar packaging to airless pumps? Is "Barrier Repair" now the dominant search intent in your category while your hero SKU doesn't contain a single Ceramide?
55% of DTC skincare brands run Triple Whale or Yotpo. Neither tool connects review sentiment to product specs. Neither cross-references competitor launches against your formulation. Neither tells you why ROAS is dropping, only that it's dropping.
The attribution trap: when the only tools you have measure distribution, every problem looks like a distribution problem.
Vertical Proof #1: The CAC Tax in DTC Skincare
A skincare founder greenlights a 20,000-unit Vitamin C serum run in jar packaging at $4.25/unit. That's $85,000 committed before a single unit ships.
Post-launch reality:
- The market has moved to airless pumps, which convert at 2x the rate of jar packaging in the serum subcategory
- 42% of 1-star reviews in the category mention packaging, not formula ("turned orange in 3 weeks," "pump broke after a month")
- 40% of reviews contain unfulfilled demand for barrier repair ingredients, but only 18% of brands include them
Meanwhile, the dashboards look like this: Klaviyo shows email revenue attribution is healthy. Triple Whale shows ROAS declining. Yotpo collects the reviews but doesn't mine them for R&D intelligence. Nobody connects the dots. The product is the bottleneck.
The revenue math is brutal. At $3.5M revenue, 73,000 customers per year, and a $32 CAC, a 25% conversion lift from spec-aligned reformulation recovers approximately $876K/yr without a single additional ad dollar. Effective CAC drops from $32 to $24.
The $85K inventory commitment? If the SKU underperforms, liquidation at 30¢ on the dollar recovers ~$25,500, destroying $59,500 in gross margin on a single decision made without strategic intelligence.
For the full breakdown of how the CAC Tax works in DTC skincare, see our deep-dive analysis.
Vertical Proof #2: Menu Stagnation in MedSpas
The blind spot isn't unique to products. Service businesses have the same gap; they just call it a "menu" instead of a "SKU."
A MedSpa owner runs Mangomint for scheduling, Podium for reviews, and a local SEO agency for GBP optimization. All distribution tools. None of them surface that "Traptox" has 340% more search demand than generic "Botox", and the menu doesn't mention it.
Worse: CoolSculpting demand is down 20% YoY while Morpheus8 is up 45%. A MedSpa considering a $150K laser purchase for a declining treatment is making a CapEx decision with zero strategic intelligence.
The cost: $10,400/mo in revenue lost because the menu doesn't reflect current demand signals.
Read more: menu stagnation is costing MedSpas $10K+/mo.
Vertical Proof #3: The Spec War in Cookware
For physical product brands, the blind spot lives on the product detail page.
A cookware brand's 5-ply bonded pan outperforms competitors in real-world testing. Superior heat distribution, better durability, longer lifespan. The product is genuinely better.
But 4 of 5 competitors claim "Metal Utensil Safe" on their listing, and this brand doesn't. "Warped" appears in 22% of competitor 1-star reviews, representing a massive positioning opportunity the brand is missing entirely.
Jungle Scout shows keyword rank declining. Helium 10 shows search volume for "non-stick pan metal utensil safe" is up. But neither tool cross-references the brand's actual spec sheet against competitor claims and review sentiment to produce an actionable PDP rewrite.
Estimated cost: $8,500/mo in lost sales from missing spec claims.
The full breakdown: the Spec War that's killing cookware listings.
The Pattern: It's Always the Asset Closest to the Customer
Zoom out across these verticals and a pattern emerges.
In remodeling, 70% of negative reviews mention dust and communication, not craftsmanship. The remodel itself is fine. The experience is broken. In dental, 62% of implant consults ghost. "Fear" appears 3x more than clinical outcomes in patient feedback. The clinical product is excellent; the experience product is failing.
Across every vertical, the asset closest to the customer (the formula, the menu, the listing, the proposal, the consultation experience) is the one with the least intelligence coverage. The thing that actually determines whether someone buys, books, or signs? That's the thing nobody's measuring.
The Closed-Loop Gap: Why Existing Tools Can't Fix This
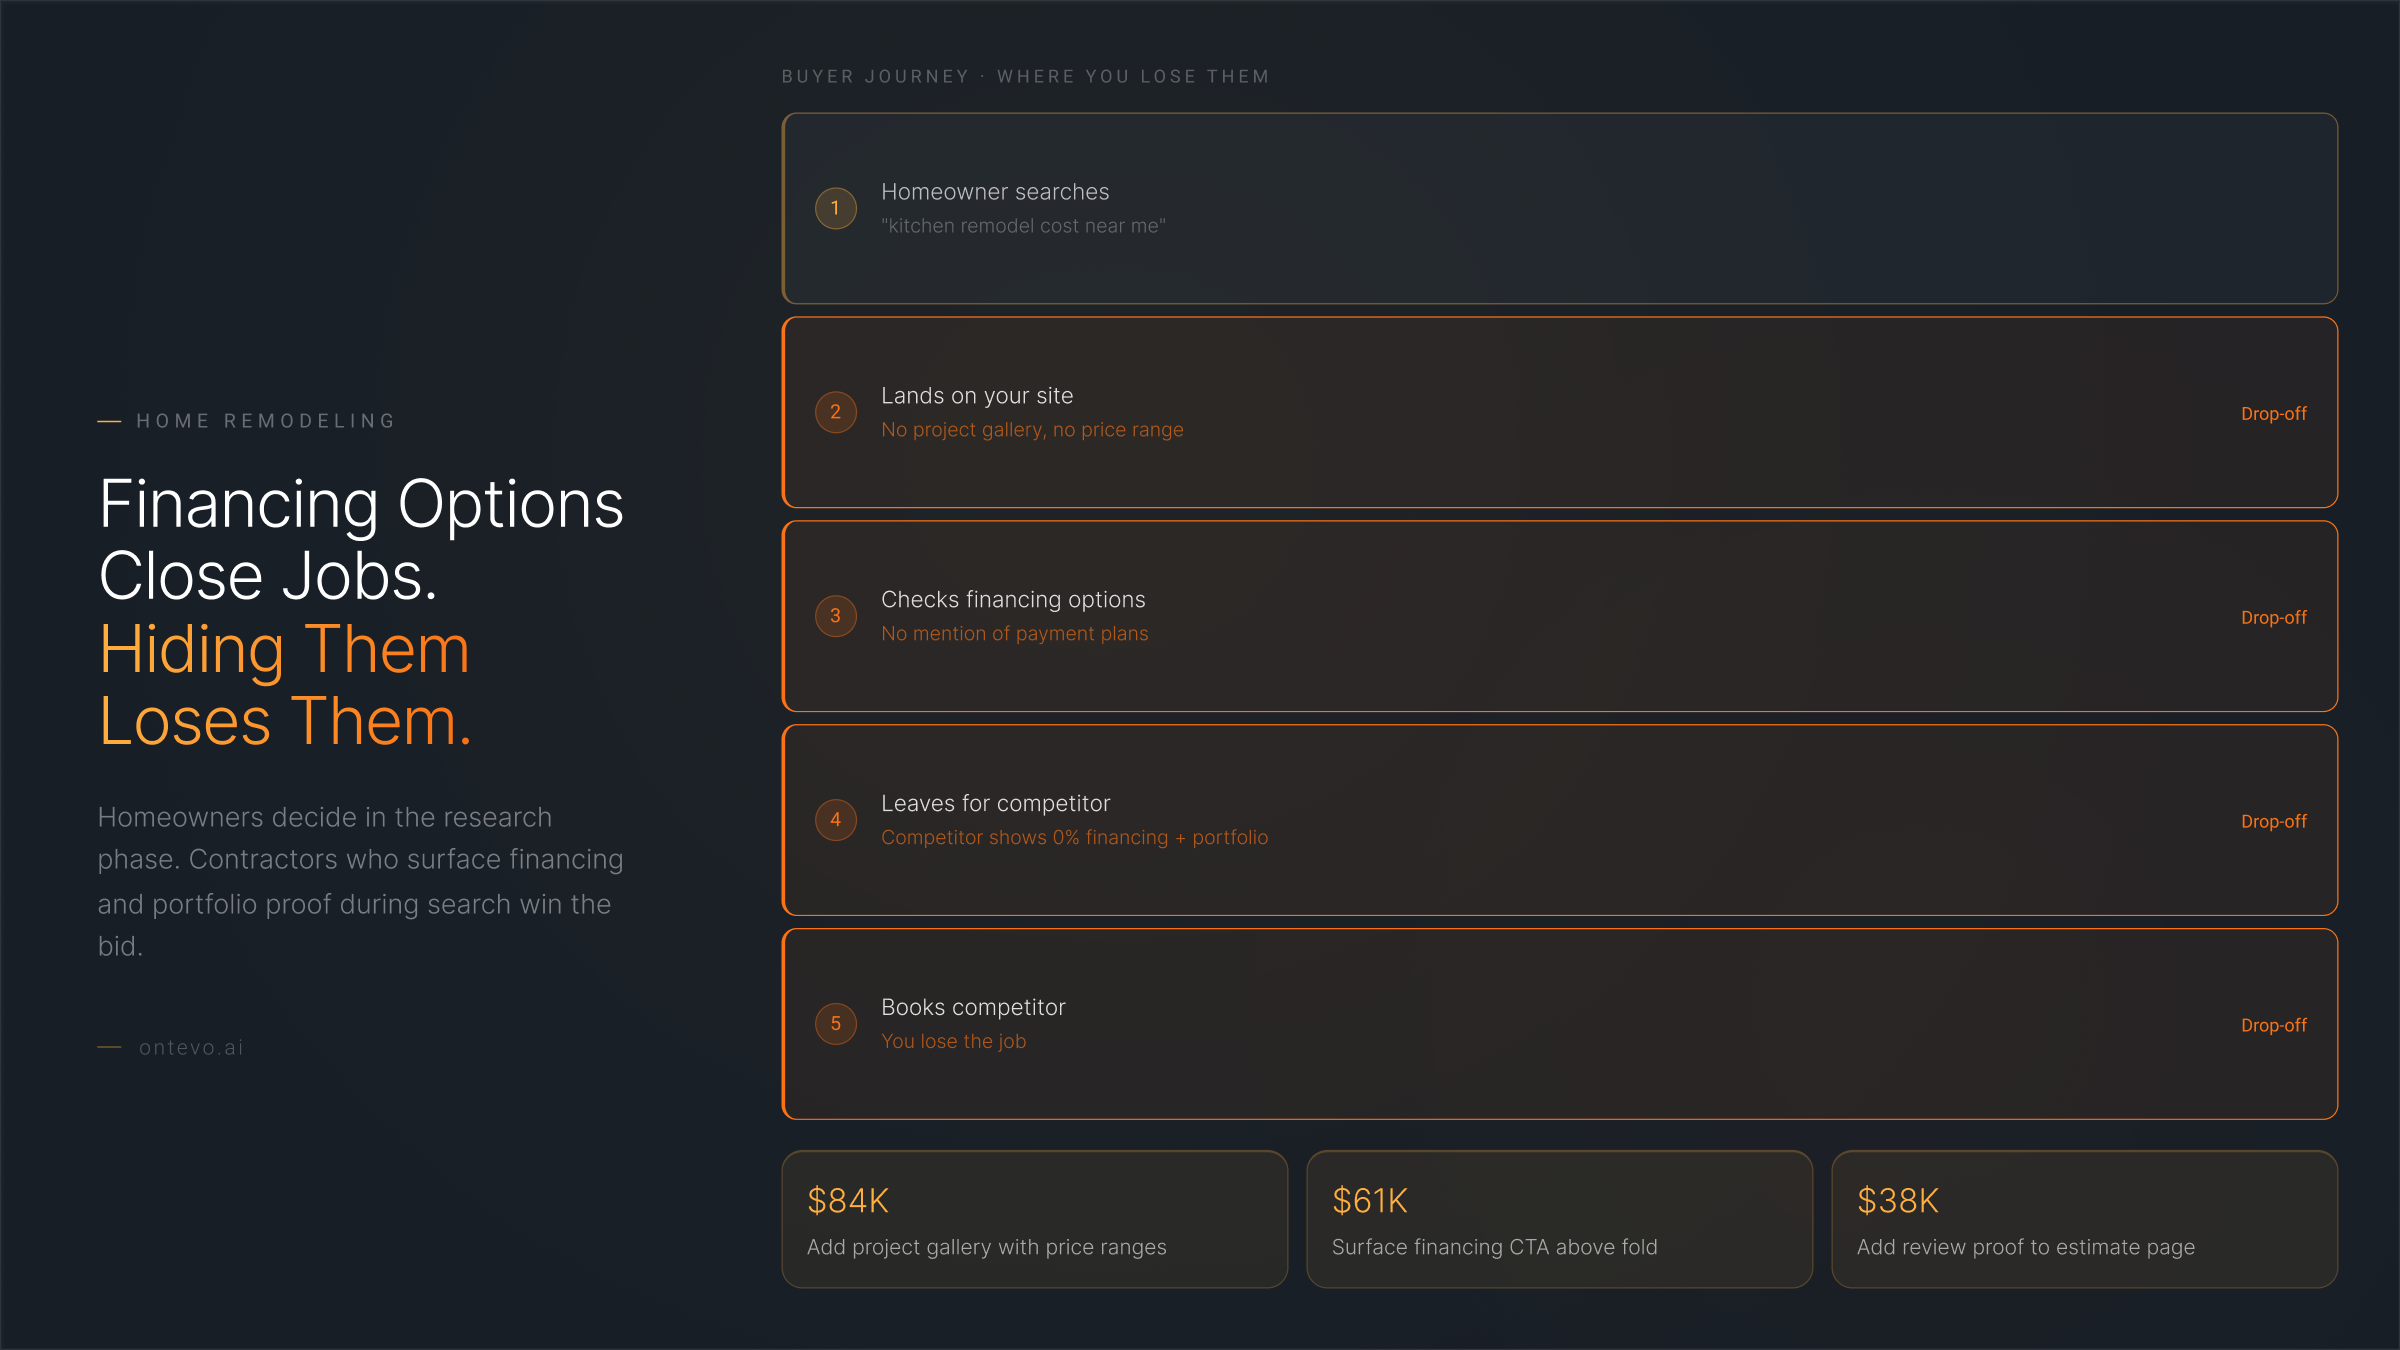
Existing tools are excellent at what they do. The problem is architectural: they were built to optimize distribution, not evaluate the asset.
Here's where each one stops short:
- Spate can tell you Bakuchiol is trending +40% YoY, but can't tell you if YOUR formulation is missing it relative to the competitive cohort
- Triple Whale can tell you ROAS dropped, but can't diagnose that the drop correlates with a competitor's new product launch
- Yotpo collects reviews, but doesn't mine them for R&D intelligence or benchmark against competitor review corpora
- Jungle Scout shows keyword volume, but doesn't cross-reference against your actual product specs
The missing link is a closed loop: trend signal → spec gap → review validation → financial quantification → actionable brief. No tool in any standard stack closes this loop.
45% of skincare brands that do use some form of intelligence tool (paying an average of $1,200/mo) report the same top pain point: inability to identify market white space. They're paying for intelligence that doesn't answer the question that matters.
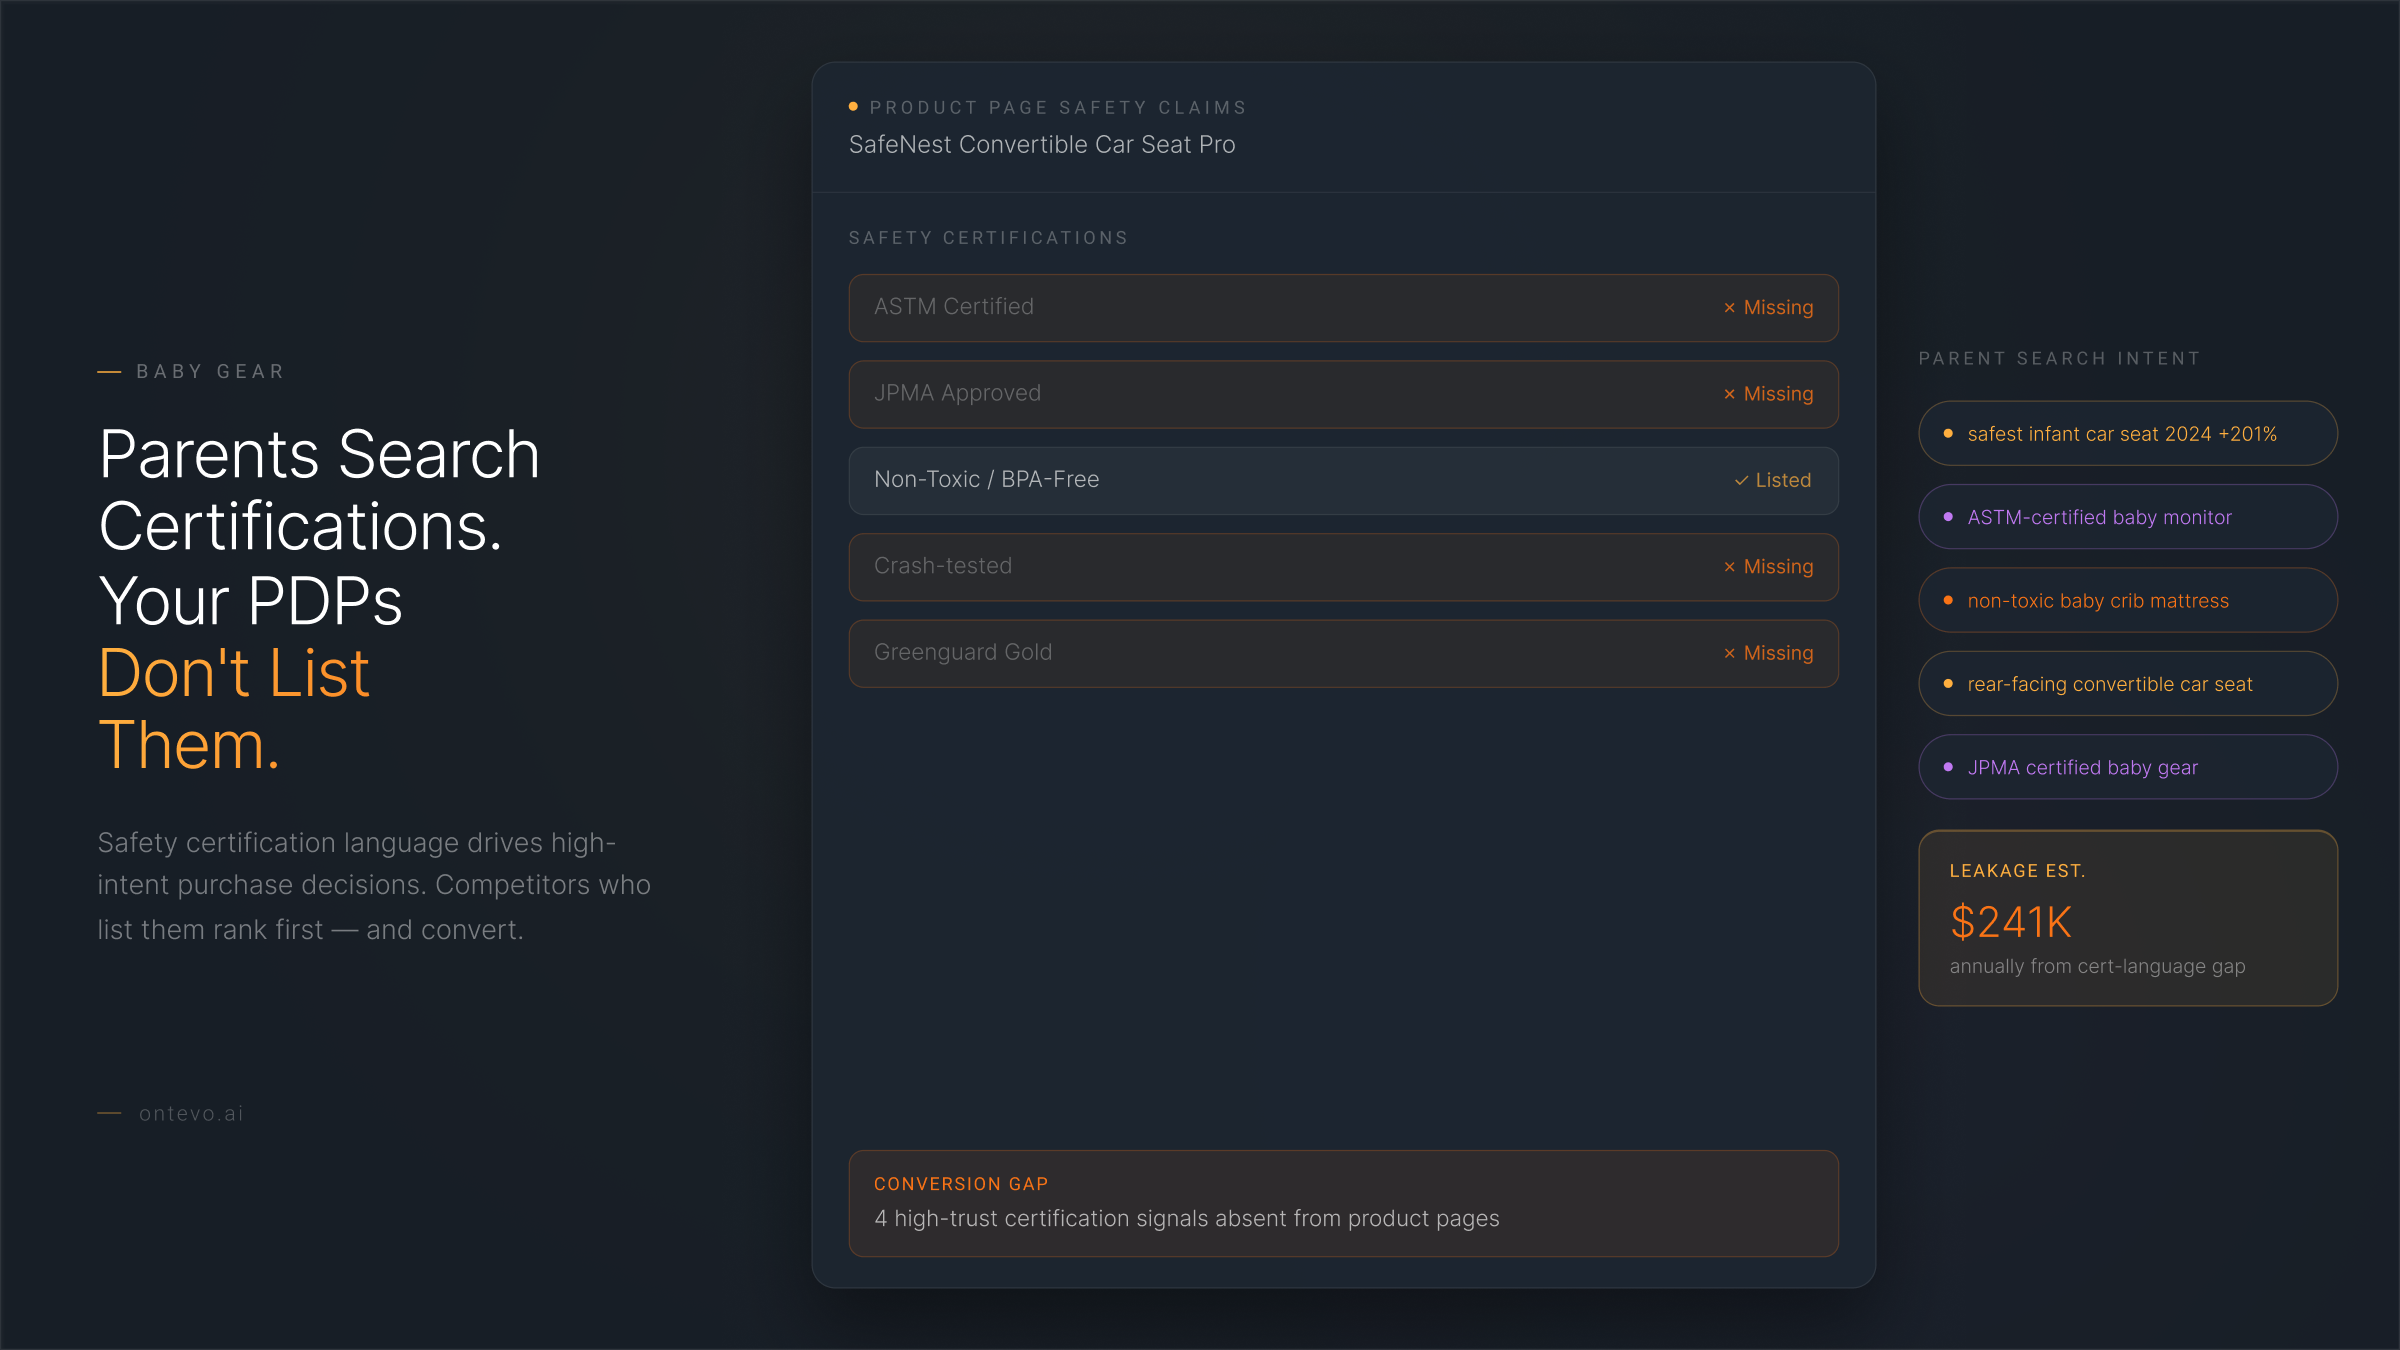
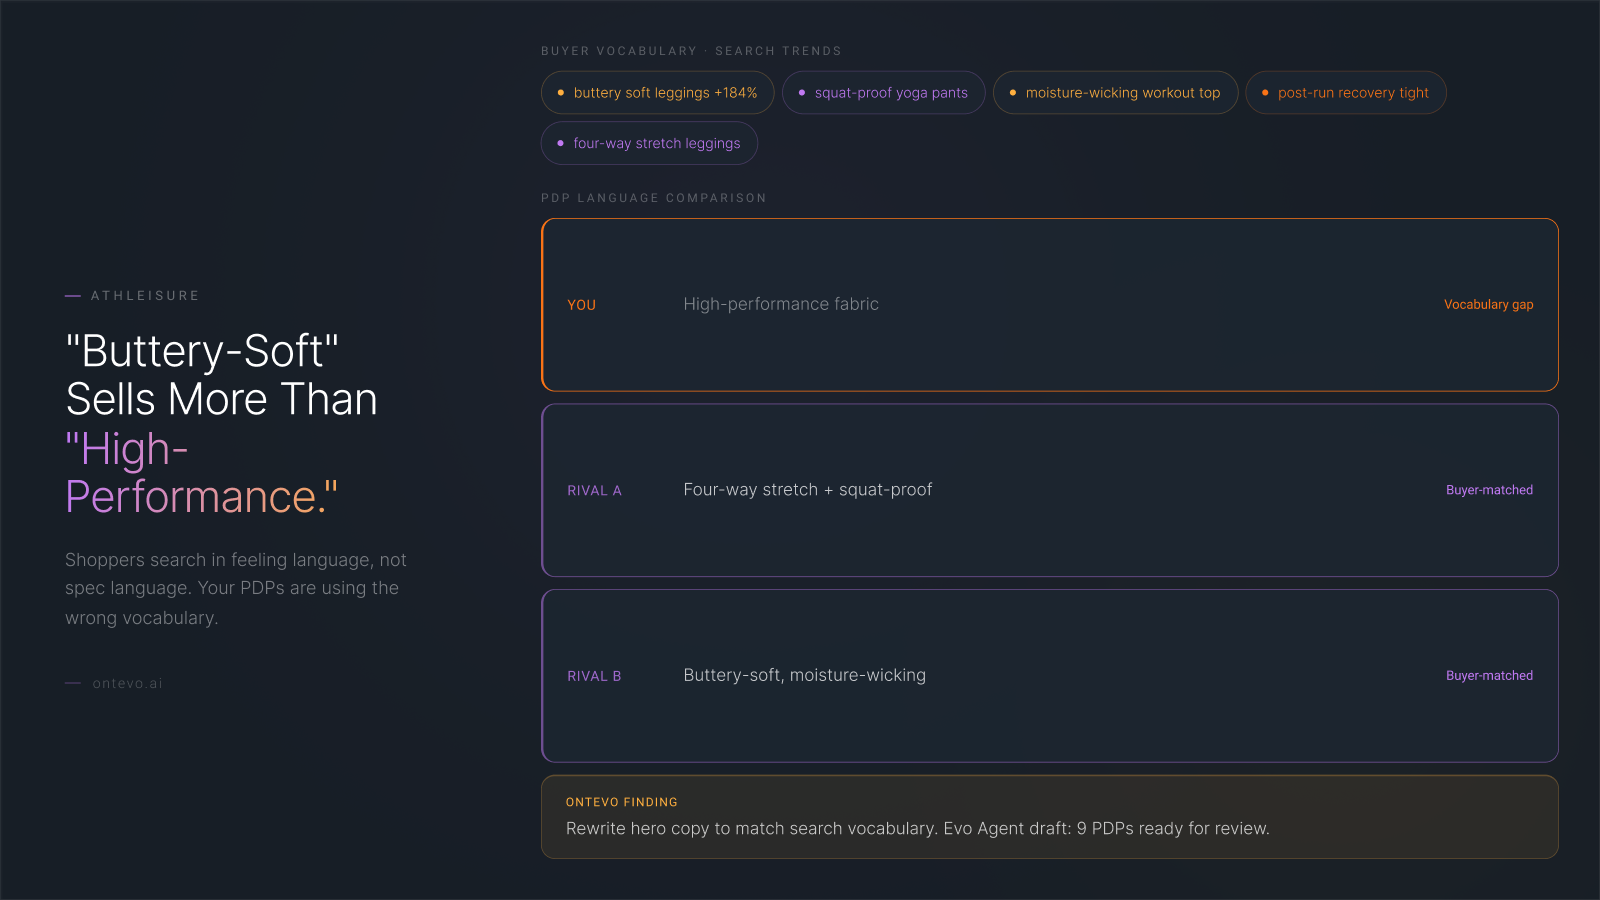
The gap requires something most tools lack entirely: a semantic bridge between how consumers talk and how products are built. Customers search "Glass Skin." The spec is Niacinamide + Hyaluronic Acid. Customers complain a pan "warped." The spec is 5-ply bonded construction. Customers want "Traptox." The clinical term is Trapezius Neurotoxin.
Without that translation layer, generic AI tools hallucinate. They can't connect "turned orange in 3 weeks" to "jar packaging lacks airless oxidation prevention" to "$876K/yr in unrealized revenue."
The Framework: Audit Your Own Stack in 10 Minutes
Here's a diagnostic you can run right now, regardless of what tools you use.
Every intelligence tool falls into one of four quadrants across two axes:
- Axis 1: Distribution Intelligence vs. Strategic Intelligence
- Axis 2: Lagging Indicators vs. Leading Indicators
Quadrant 1: Distribution + Lagging
ROAS, email open rates, conversion rate, revenue attribution. This is where most dashboards live. They tell you what happened last week.
Quadrant 2: Distribution + Leading
Predictive LTV models, cohort analysis, churn prediction. Better, but still assumes the product is fixed. You're predicting future distribution efficiency of a potentially obsolete asset.
Quadrant 3: Strategic + Lagging
Post-mortem competitive analysis, quarterly market reports (Mintel at $5–15K/yr). Useful but slow. By the time the report lands, the market has moved again.
Quadrant 4: Strategic + Leading
Real-time wishlist mining, spec gap detection, trend velocity scoring, price-value delta mapping. This is the blind spot.
Here's the exercise: List every tool in your stack. Categorize each into a quadrant. If Quadrant 4 is empty (and for most businesses, it is), you have the innovation blind spot. You're navigating with a rearview mirror and calling it intelligence.
What a Strategic Intelligence System Actually Looks Like
Whether you build it yourself, hire an analyst, or use a platform, here are the five capabilities any business should demand from Quadrant 4:
- Review corpus mining across platforms: not just your own reviews. Competitor reviews are the market research. Your reviews are the report card.
- Feature/spec benchmarking against the competitive cohort, not keyword tracking. That means actual product attribute comparison: who claims what, who's missing what, and where the white space is.
- Price-value mapping that connects review sentiment to pricing thresholds. "Customers love the formula but 34% say it's overpriced at $48" is intelligence. "AOV is $48" is a number.
- Trend velocity scoring that links search demand to product-level gaps. Not just "Bakuchiol is trending" but "Bakuchiol is trending +40% YoY, your cohort is at 12% adoption, and your review corpus contains 340 explicit requests for retinol alternatives."
- Financial quantification: every gap should have a dollar sign. "You're missing Ceramides" is an observation. "Missing Ceramides costs you $14,200/mo in unrealized conversions" is intelligence.
The architecture matters more than the vendor. If your intelligence stack can't produce an artifact that a CFO would act on (a specific dollar figure, a specific gap, a specific fix), it's a dashboard, not strategic intelligence.
For more on how AI agents execute the fixes these systems identify, see why the next wave of AI replaces labor, not dashboards.
The Compounding Cost of Not Knowing
The blind spot is a compounding tax, not a one-time miss.
For a $3.5M skincare brand, the annual math looks like this:
- $876K/yr in unrealized revenue from spec misalignment (the conversion lift you're not getting)
- $85K in dead inventory from a single bad SKU launch (the CapEx bet made without intelligence)
- $73.5K/yr in SaaS costs optimizing a broken funnel (the tools that can't see the problem)
Total: $1.03M+ annual cost of the blind spot. For a $3.5M brand, that's 29.5% of revenue.
And it compounds. Every month the product stays misaligned, negative reviews accumulate. Organic rank decays. CAC rises. Competitors capture the whitespace you left open. The gap widens, and the cost of closing it increases.
This isn't unique to skincare. MedSpas lose $10,400/mo on menu stagnation. Cookware brands lose $8,500/mo on missing spec claims. Remodelers lose $22,800/mo on proposal gaps. The blind spot is universal. Only the symptoms are vertical-specific.
The Most Expensive Decision in Business
Open your SaaS stack right now. Every tool, every subscription, every agency retainer. Categorize each one into the four quadrants above.
Then find one (just one) that tells you whether your product, your menu, or your service is still aligned with what the market actually wants right now, not what it wanted when you launched or last quarter.
If you can't find one, you have the blind spot. And every dollar you spend optimizing distribution is a dollar spent driving faster toward a city that moved.
The most expensive decision in business is the right ad spend on the wrong product, not the wrong ad spend.
Ontevo Research. Where this post carries figures, they come from Ontevo's own scan corpus or are modeled from scan patterns across the category. No figure is measured from a named customer.