85% of Local Businesses Are Missing from the Map Pack. Are You?
Ontevo Research. Source: Ontevo's multi-vertical local-business audits across med spas, dental specialty practices, remodeling contractors and skincare clinics. Method: each audited business was scored against the seven signals Google's Local Pack weights, and counted as missing where it never appeared for its highest-intent local queries. The dollar ranges in this post are modeled from those scan patterns, not from a named customer.
If You're Not in the Map Pack, You Don't Exist
Google's Local Pack (the three-result map module that appears above organic listings on "near me" queries) captures roughly 44% of all local search clicks. Position #1 alone takes more than half of those.
And yet, across the multi-vertical local-business audits we've run (med spas, dental specialty practices, remodeling contractors, MedSpa-adjacent skincare clinics), 85% of audited businesses never appear in the Map Pack for their highest-intent local queries.
That's rarely because they're bad businesses; the visibility infrastructure underneath them is misaligned with how Google ranks local results in 2026.
The 7 Signals Google Actually Weights
Local Pack ranking isn't a black box. Google has been transparent about the inputs. The cohort that wins runs them all simultaneously:
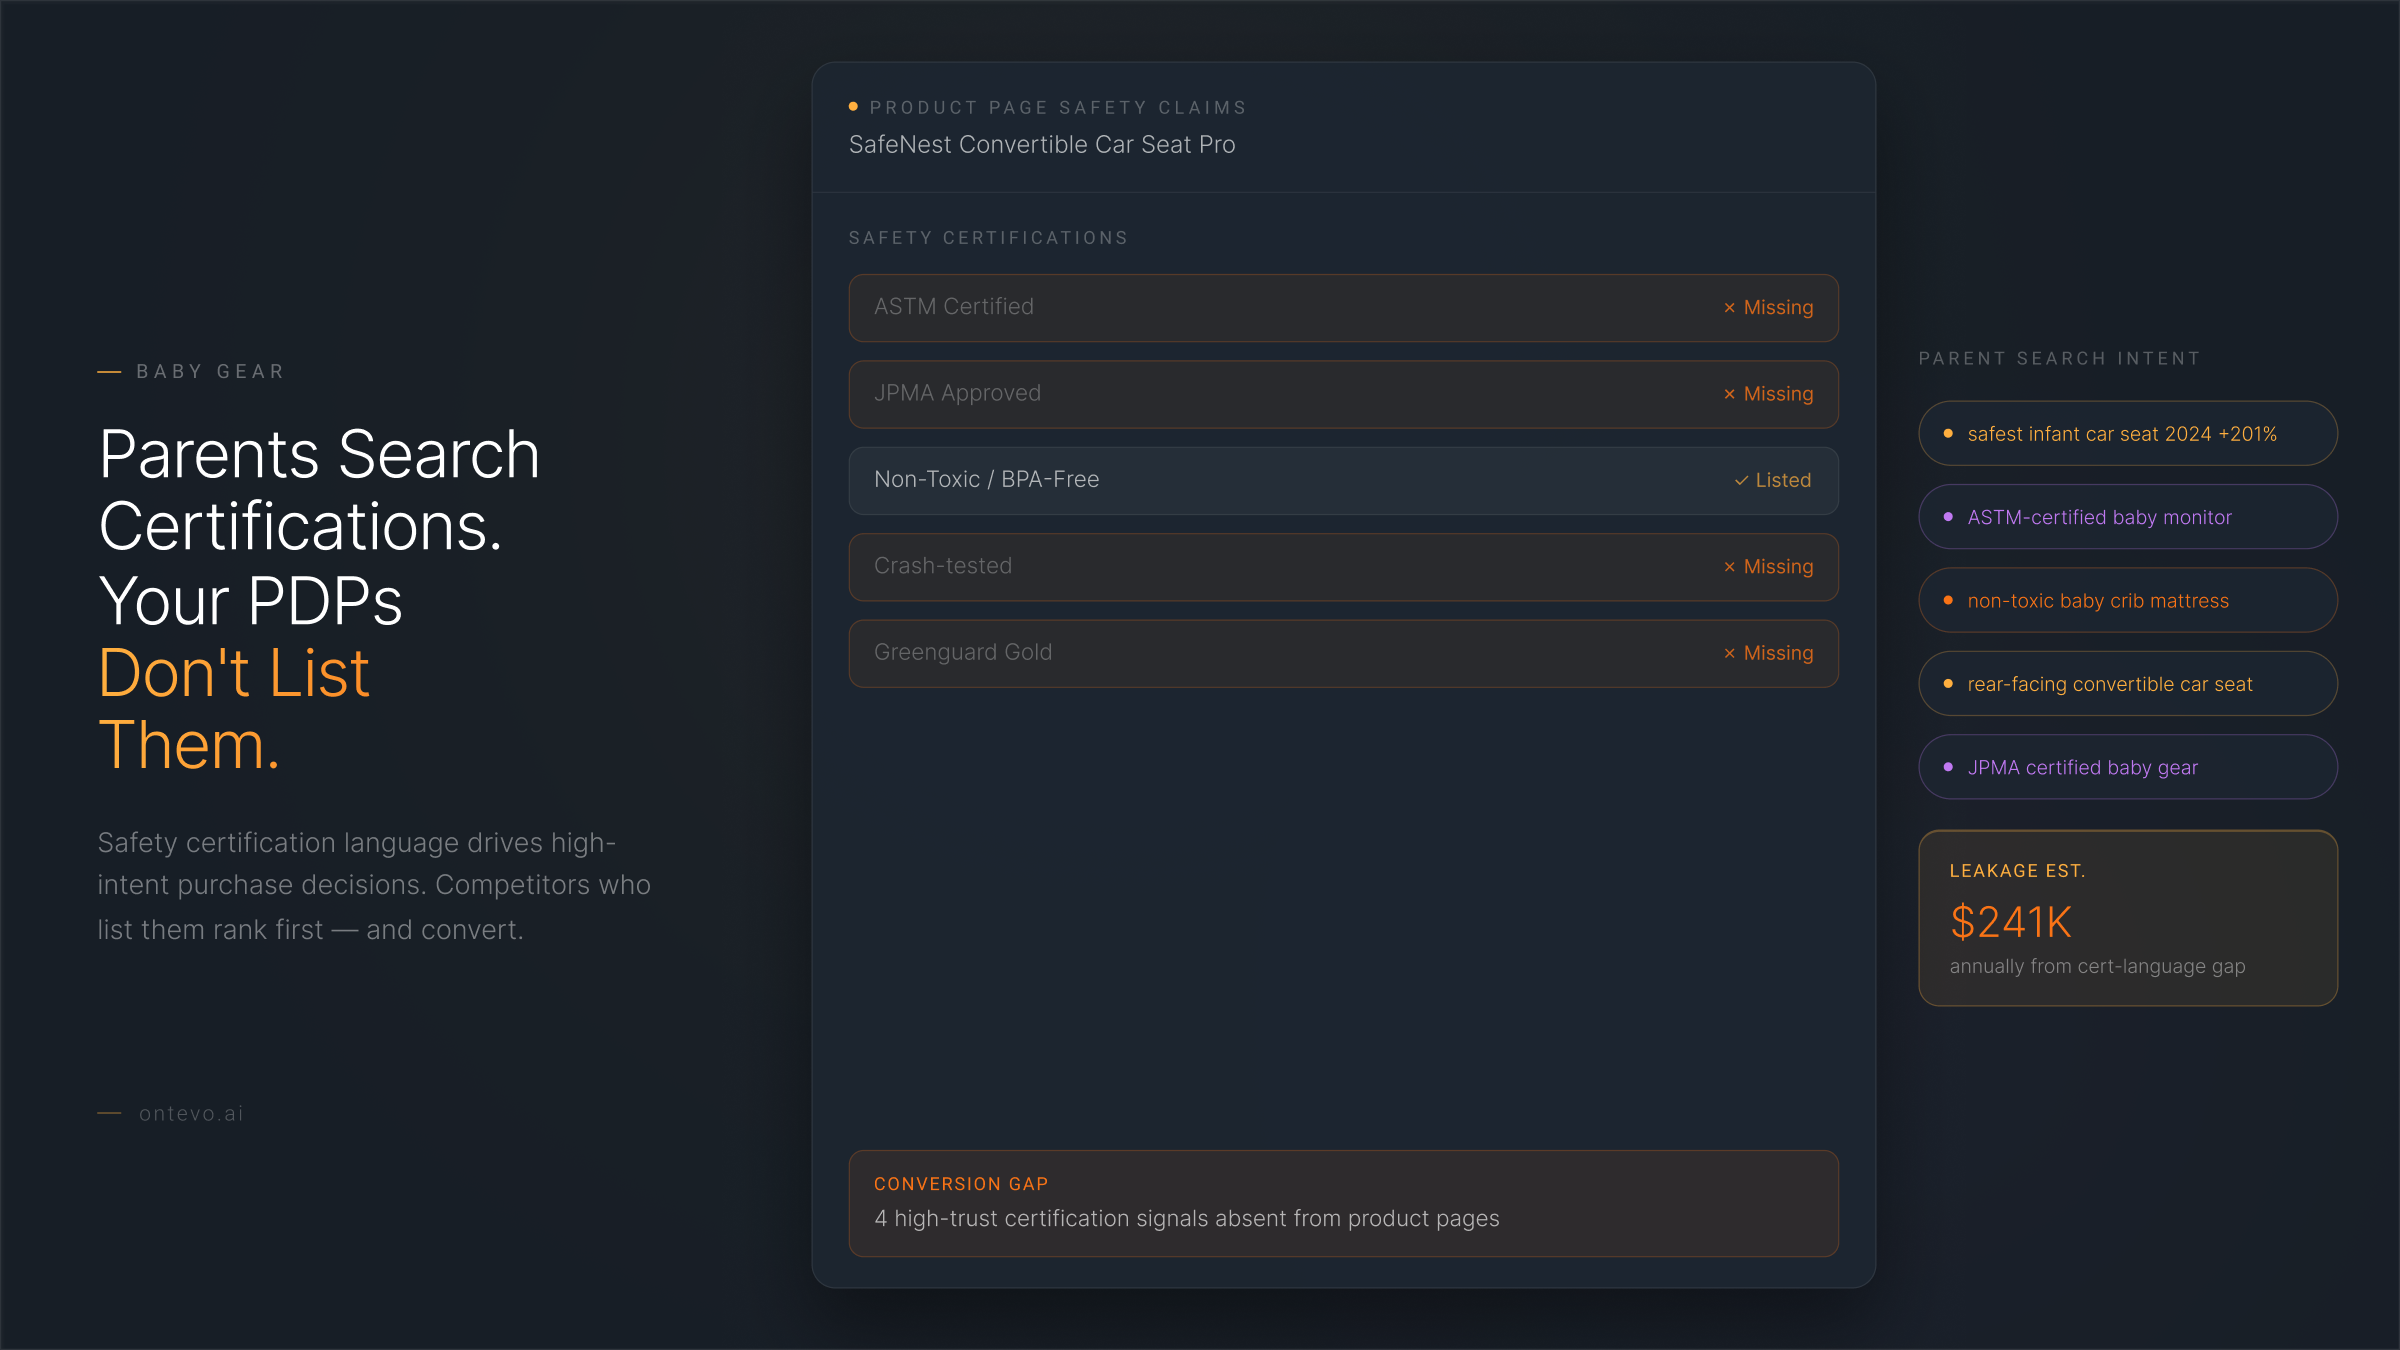
- Relevance. Does your GBP service language match the actual query? "Sedation Dental Implants" beats "Dentist" for the anxious-patient query, every time.
- Distance. Proximity to the searcher. The one signal you can't optimize, but you can optimize how you show up to the queries that DO come from your radius.
- Prominence. Review count, review recency, citations, web mentions, and the depth of your GBP profile.
- Engagement. Calls, direction requests, website clicks. Google rewards profiles people interact with.
- Freshness. Posts in the last 30 days. Photos in the last 90. Profile abandonment is a demotion signal.
- Q&A and attribute completeness. Every unanswered question and unchecked attribute is a missed filter match.
- NAP consistency. Name, Address, Phone identical across the top 10 citation sources. A suite-number discrepancy can suppress your rank.
The Dollar Cost Per Missing Signal
Across the audit dataset, here's the median monthly leak each gap creates for a service business doing $80K to $120K/mo in revenue:
- Wrong primary category: $4K to $6K/mo: you compete in the wrong pool entirely.
- Service-name semantic gap: $3K to $8K/mo: the highest-intent queries route to competitors.
- Photo undersupply: $1K to $2K/mo: lower CTR, fewer direction requests.
- Stale review velocity: $2K to $4K/mo: ranking AND trust suppression.
- Zero GBP posts in 90 days: $500 to $1.5K/mo: the freshness penalty.
- Empty Q&A and unchecked attributes: $500 to $1K/mo: missed filter matches.
- NAP drift across citations: $1K to $2K/mo: trust signal degradation.
A practice with three of seven gaps is leaking $7K to $15K/mo before any other channel issue is considered. That's $84K to $180K/year walking past the front door because of a profile, not a product.
Vertical Patterns We Saw
MedSpa
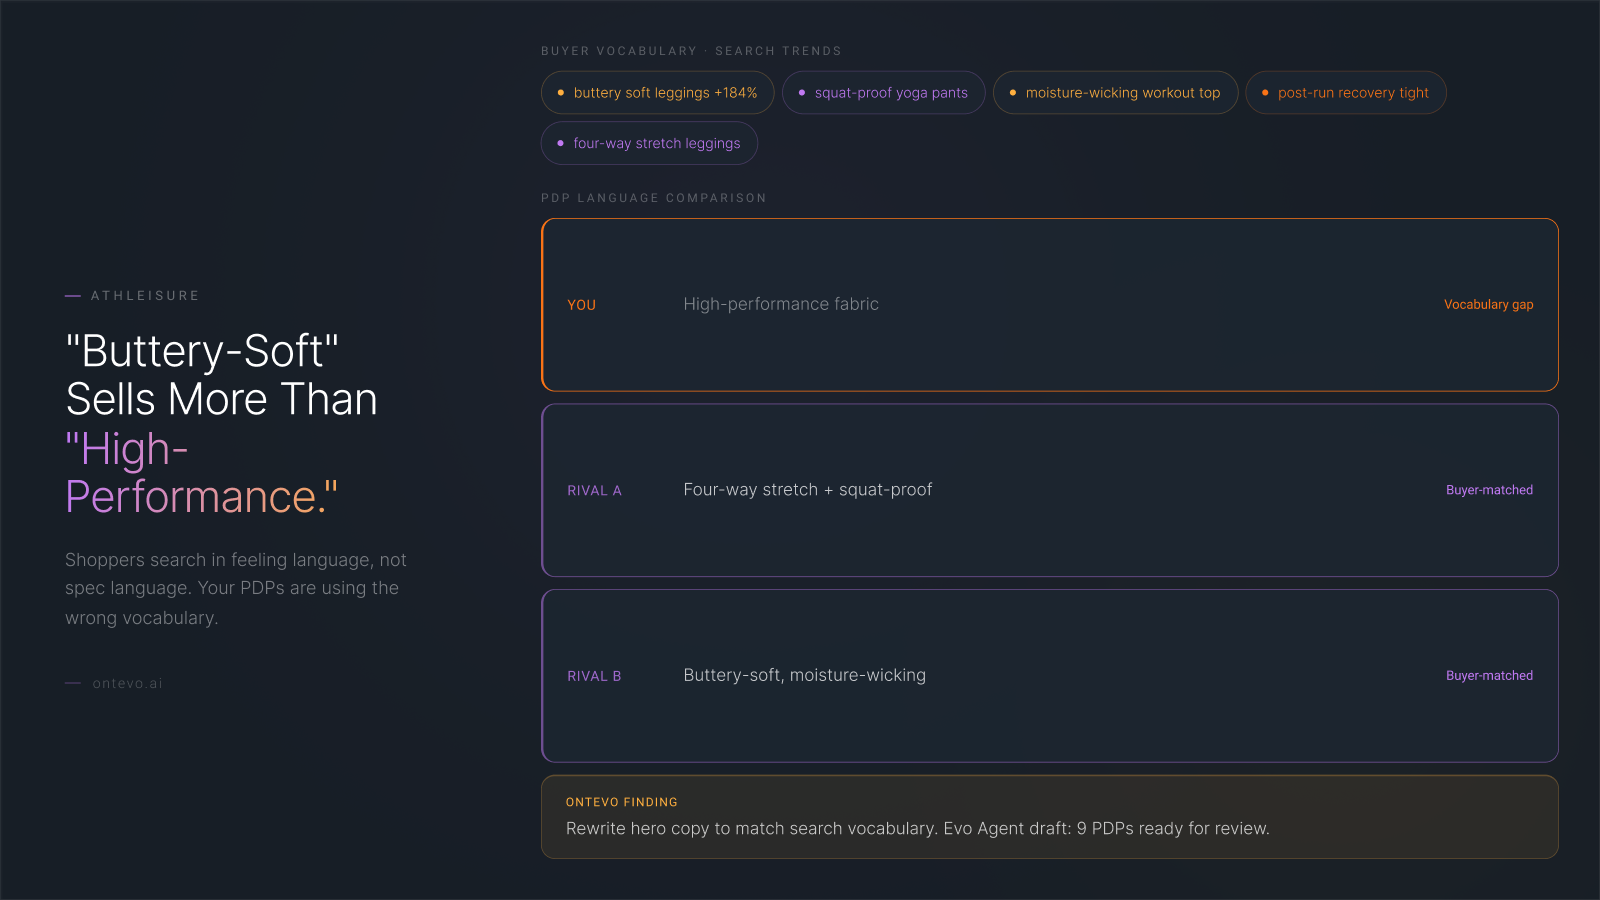
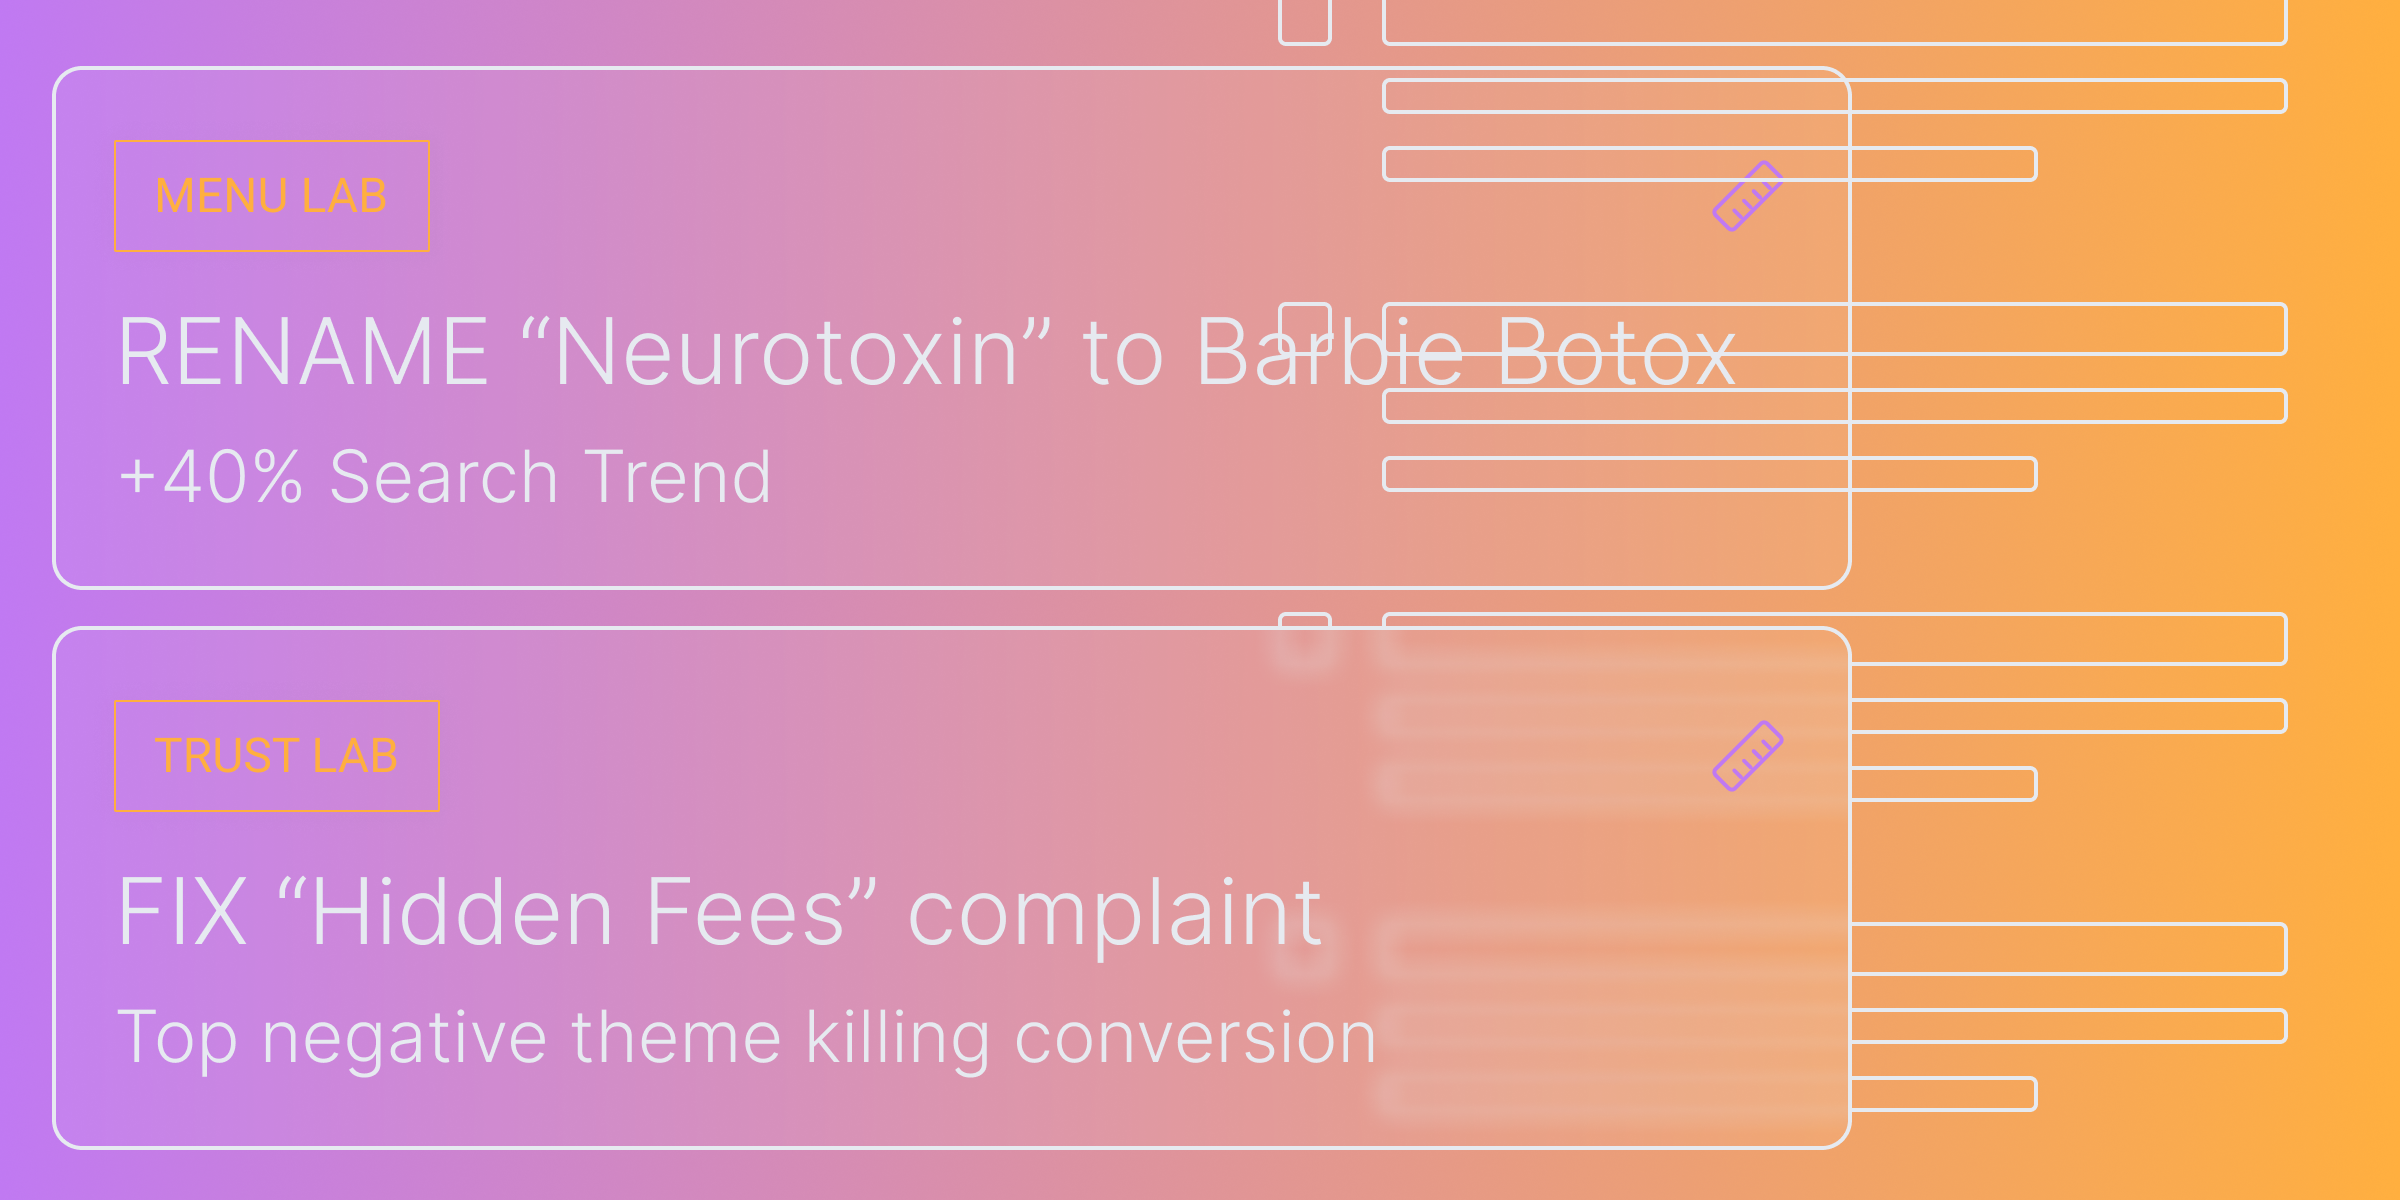
The translation gap is loudest. "Botox Cosmetic" on the GBP, "Traptox near me" in the search bar. 340% YoY demand growth on the patient term. Most practices haven't renamed a service since 2023.
Dental Specialty
Comfort silence. 72% of local dental searches include anxiety or comfort modifiers ("sedation," "painless," "financing"). Most specialist GBPs mention zero. The DSO competitor optimized for the exact term and is collecting the patient.
Remodeling
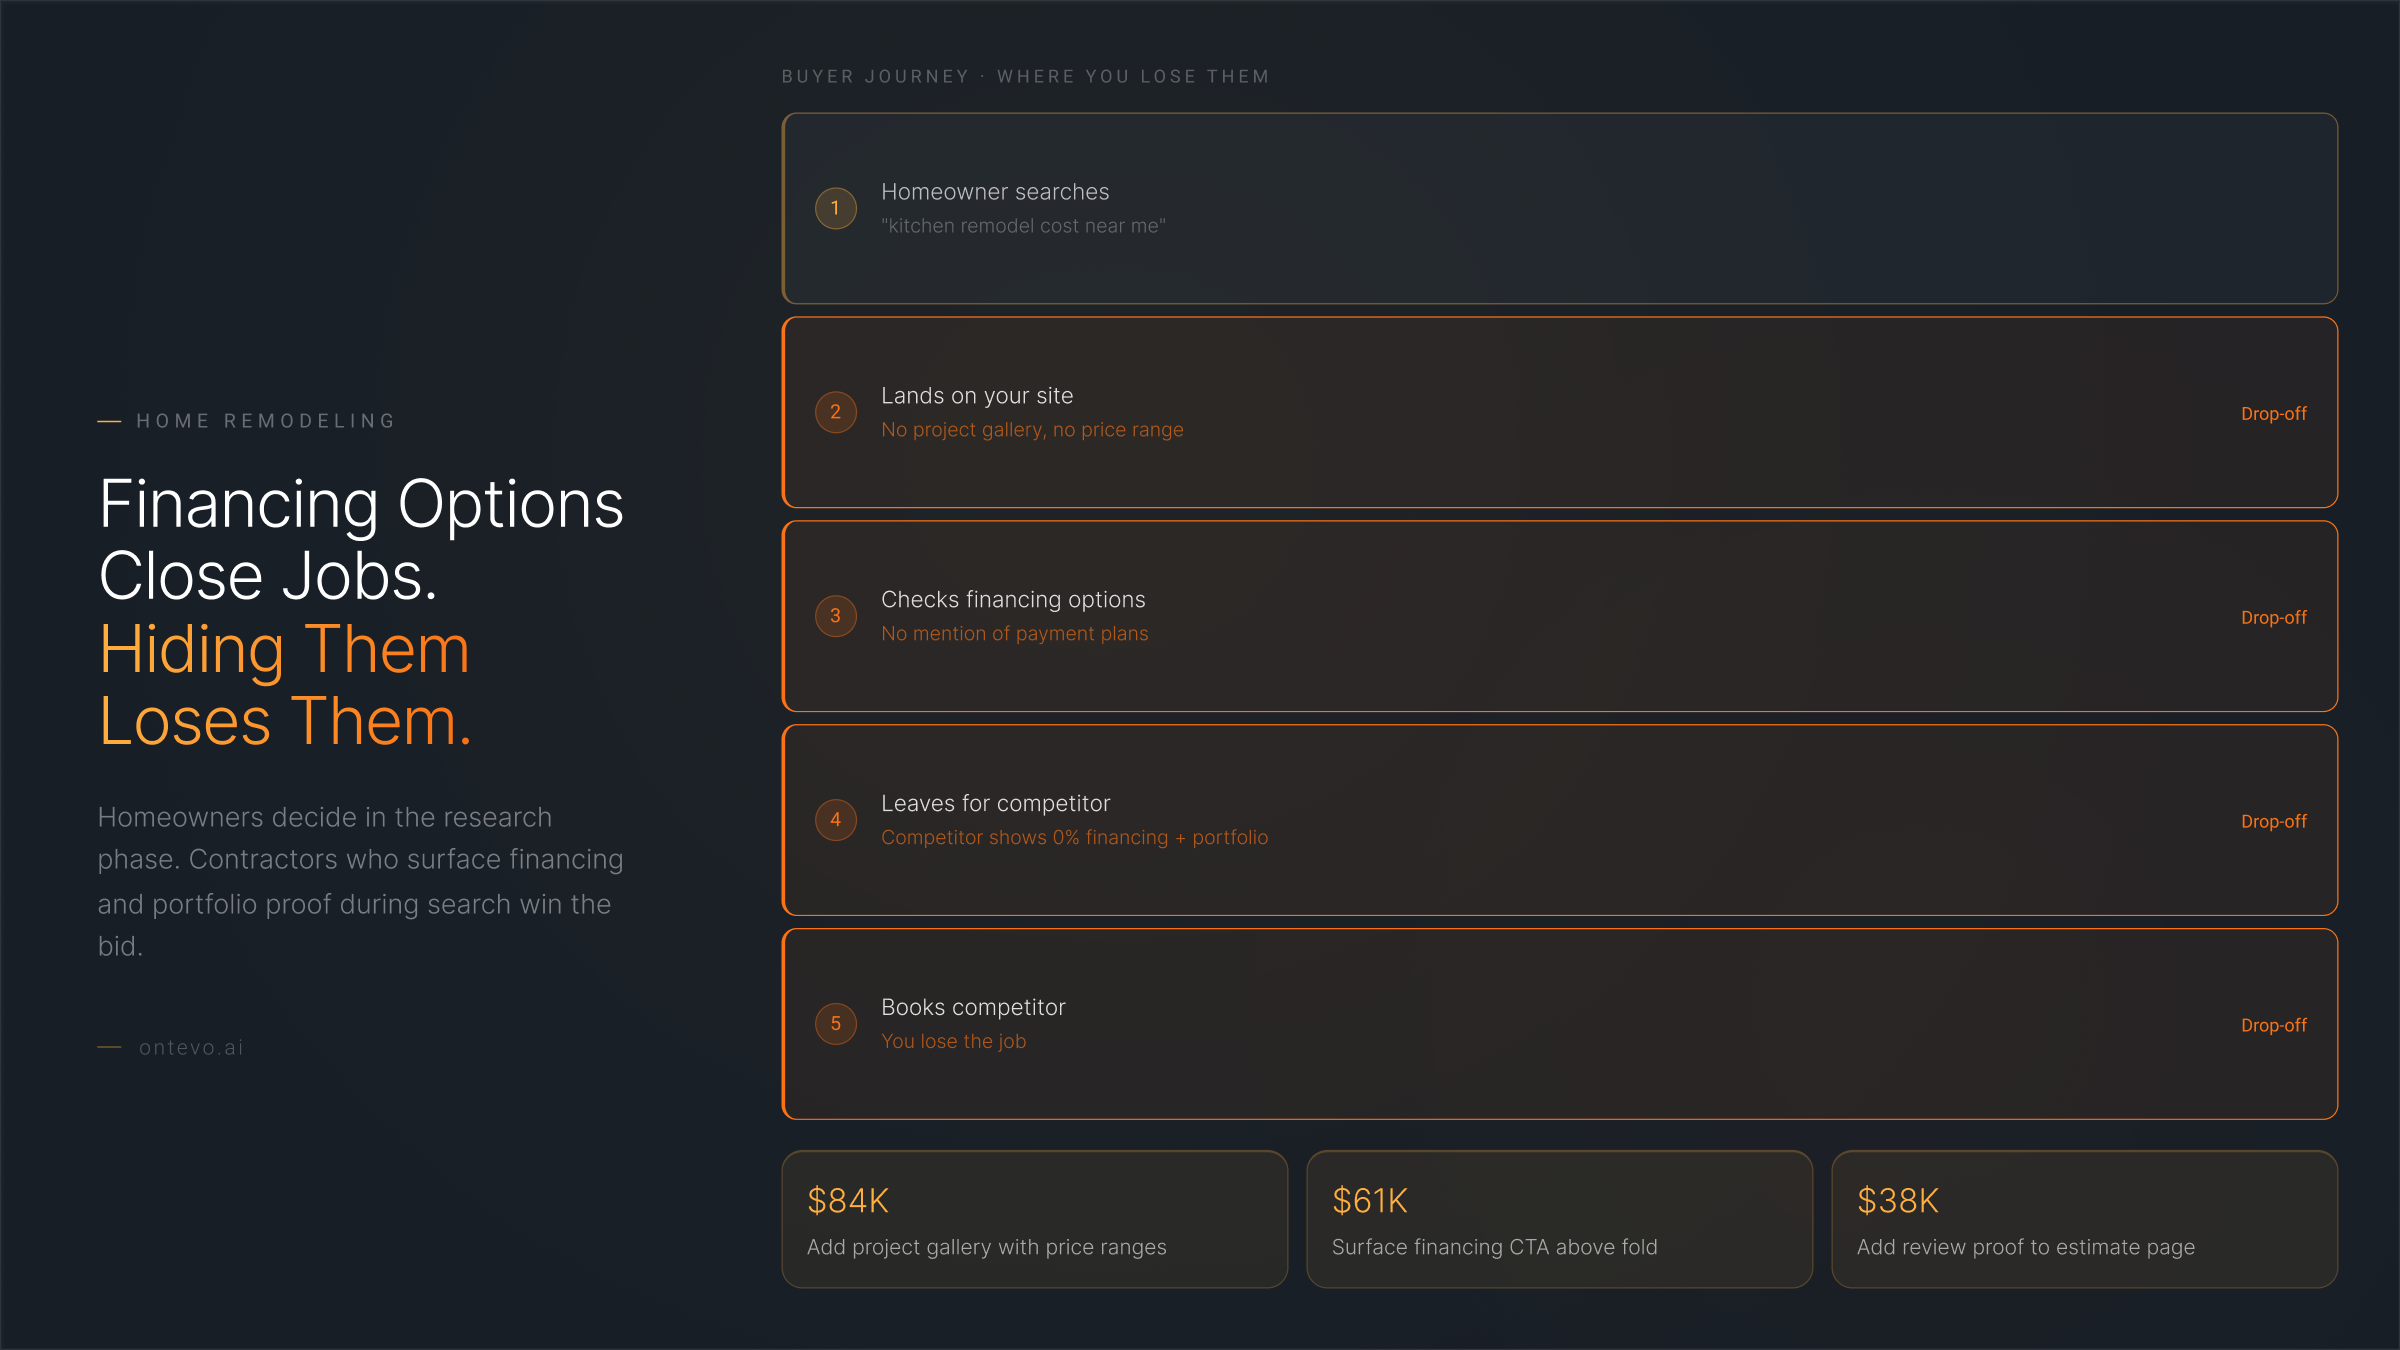
Process invisibility. Homeowners search "dust-free remodel" and "financing options." Most contractor GBPs list "Kitchen Remodeler" and stop there. Patients are comparing process trust signals, not prices, and the GBP is the first stop.
The 90-Day Fix
No tool required. Run this checklist over a quarter and most practices clear five of seven gaps without a single ad dollar.
- Week 1. NAP audit across your top 10 citation sources. Fix every discrepancy.
- Week 2. Compare your service list to the top 5 local competitors. Add every missing service term that matches actual search demand.
- Week 3. Photo shoot. Treatment rooms, results (with consent), team, exterior. Target 45+ photos.
- Week 4. Seed 5 Q&A entries based on top front-desk questions.
- Weeks 5–9. Weekly GBP posts. Trending services, seasonal specials, patient education.
- Weeks 10–12. Build a sub-12-hour review response protocol with specific, empathetic language. Drive review velocity to match top-quartile competitors.
For the full 15-element framework, see our complete GBP optimization audit.
The Question Worth Asking
If 85% of local businesses are invisible to the Map Pack, the practice that audits this quarter has 60–90 days before half the cohort follows. After that, the visibility advantage compresses back to baseline.
The framework works. The question is whether you run it before your competitor does.
Ontevo Research. Where this post carries figures, they come from Ontevo's own scan corpus or are modeled from scan patterns across the category. No figure is measured from a named customer.